Protecting your strategies - Part 2: timeframes, stacking, and stress-testing
In Part 1, we covered how individual settings - triggers, amounts, cooldowns, and minimum positions - protect your capital during a crash. But there’s a deeper layer of strategy design that separates the prepared from the panicked: choosing the right timeframe and running multiple strategies that complement each other.
This post covers the when and the how many. And then we’ll show you how to use Aurono Lab to validate your entire setup against real historical crashes - before risking a single euro.
The power of timeframe selection
Every strategy has a heartbeat: the timeframe. It determines how often Aurono evaluates the market and how it measures price changes. A 1h strategy sees the world in hourly candles. A 1d strategy sees daily candles. They’re looking at the same market, but they see completely different signals.
This distinction matters enormously in volatile markets.
Hourly: harvesting the noise
A 1h strategy evaluates every hour. In a volatile market, hourly candles show wild swings - 3% up, 4% down, 2% up, 5% down. To a daily strategy, this might be a flat day. To an hourly strategy, it’s four or five trading opportunities.
Hourly strategies are volatility harvesters. They buy small dips and sell small rallies, making many small trades that compound over time. In a crash, they keep buying at each hourly low. During recovery, they sell at each hourly bounce.
The risk: they can burn through capital quickly if every hour is a new dip. This is where cooldown and buy amount become critical.
Best for: assets with high intraday volatility, small position sizes, frequent activity.
4-hour: the balanced middle ground
A 4h strategy evaluates six times per day. It filters out most intraday noise but still catches meaningful swings within a trading day. A 5% drop on a 4h candle is a genuine move, not just a wick.
4-hour strategies balance opportunity and restraint. They trade often enough to participate in volatility but slowly enough that a 3-period cooldown means waiting 12 hours - enough time for panic to subside and trends to clarify.
Best for: most assets, moderate position sizes, daily engagement without hourly anxiety.
Daily: catching the big picture
A 1d strategy evaluates once per day at midnight UTC. It sees only the daily close - all the intraday drama is compressed into a single candle. A 5% daily drop is a significant event. A 10% daily drop is a capitulation signal.
Daily strategies are accumulation engines. They buy the real dips - the ones that make headlines - and sell the real rallies. They trade rarely, hold patiently, and compound over weeks and months.
In a crash, a daily strategy with a 10% trigger might fire only two or three times across the entire event. But those purchases are at or near the bottom, with an ACB that’s hard to beat.
Best for: high-conviction assets (BTC, ETH), larger position sizes, long-term holders who want automation without micromanagement.
Weekly: the long game
A 1w strategy evaluates once per week, on Monday at midnight UTC. It sees the market through weekly candles. A 10% weekly drop is a rare event - maybe five or six times per year across all of crypto.
Weekly strategies are black swan catchers. They sit dormant for weeks, then deploy capital at the deepest discounts. A weekly strategy with a 15% trigger and generous capital might only trade once or twice per year - but those trades can define your portfolio’s long-term performance.
Best for: accumulation of core holdings, very long time horizons, “set and forget” positions.
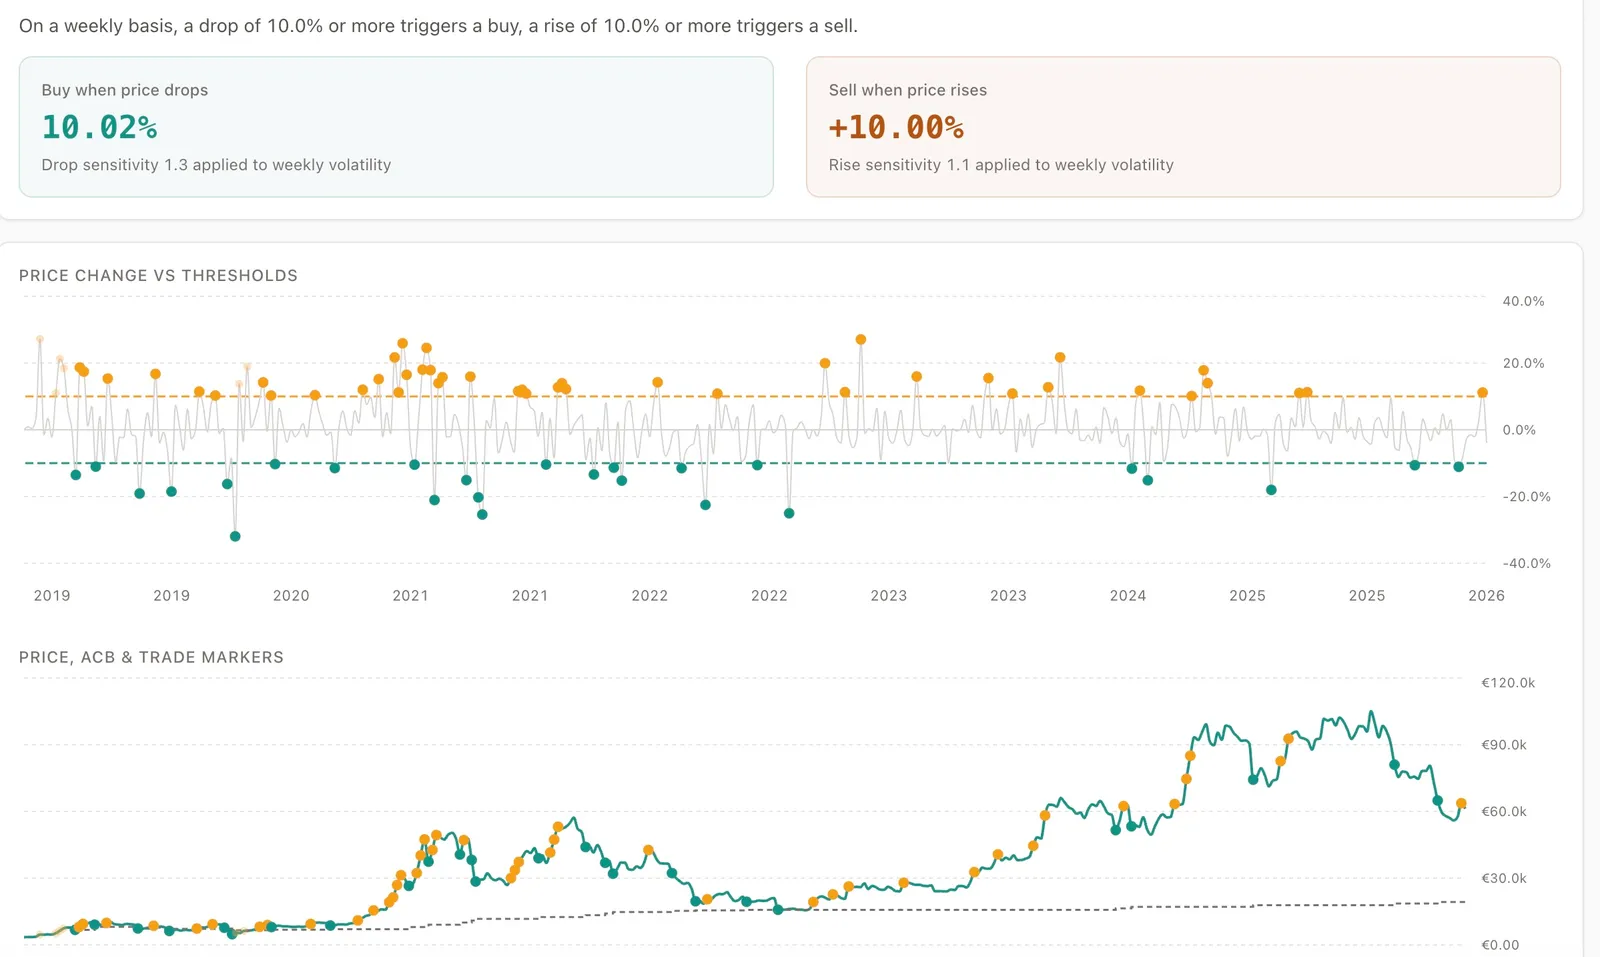
Here’s what that looks like in practice - a weekly BTC/EUR strategy with a ~10% trigger in Aurono Lab. The upper chart shows price changes versus the threshold lines. The lower chart shows the actual price with executed trades (solid) and ignored signals (opaque). Notice how the trigger only fires during the real drops - the crashes that make headlines.
Multi-strategy diversification
Here’s where it gets interesting. You don’t need to choose one timeframe. You can run multiple strategies on the same asset, each playing a different role.
The stack: layers that complement each other
Think of your strategies as layers, each with a different job:
| Layer | Timeframe | Trigger | Amount | Role |
|---|---|---|---|---|
| Harvester | 1h | 2-3% | Small (€5-10) | Capture intraday volatility, frequent small trades |
| Swing trader | 4h | 4-6% | Medium (€15-25) | Catch meaningful moves, balance activity and patience |
| Accumulator | 1d | 8-12% | Larger (€25-50) | Buy the real dips, build core position at low ACB |
| Black swan catcher | 1w | 15-20% | Significant (€50-100) | Deploy capital only during extreme fear events |
Each layer operates independently. The hourly strategy might make 30 trades in a month. The weekly strategy might make zero. But when the weekly trigger fires, you know something significant happened - and you’re buying at a price that only comes around a few times per year.
Why this works in a crash
During a sudden 30% crash over 3 days:
- Your hourly harvester fires several times on day 1, uses up its capital, then stops. It bought the early dips - not great, but not terrible.
- Your 4h swing trader fires a few times across days 1-2, pacing buys every 12 hours (with cooldown). Better average price.
- Your daily accumulator fires on day 2 or 3, buying at the deeper discount. Strong ACB.
- Your weekly black swan catcher fires at the end of the week, buying at or near the bottom. Best ACB of all.
No single layer had to carry the full weight. Together, they deployed capital at every depth of the crash, giving you a blended ACB that’s much better than any single-timeframe strategy could achieve.
During recovery
The same layers work in reverse:
- The hourly harvester starts selling first - small bounces, frequent trades, quick capital recycling.
- The 4h swing trader sells on stronger moves, restoring capital for the next dip.
- The daily accumulator sells only on big daily rallies, preserving the core position.
- The weekly catcher holds - it bought at deep discount and there’s no rush to sell.
Capital flows up and down the stack naturally. The hourly layer is always active, recycling capital. The weekly layer is patient, holding the strongest positions.
Capital allocation across layers
A common approach: allocate more capital to slower layers and less to faster ones.
| Layer | % of total capital | Why |
|---|---|---|
| Hourly harvester | 10-15% | Small trades, fast cycling |
| 4h swing trader | 20-25% | Moderate trades, daily activity |
| Daily accumulator | 30-35% | Bigger trades, fewer but more impactful |
| Weekly catcher | 25-30% | Large trades at deep discounts, rarely used |
The exact split depends on your conviction in the asset and your risk tolerance. For a high-conviction asset like BTC, you might put more in the weekly layer. For a volatile altcoin, more in the hourly layer.
Test your plan with Aurono Lab
Everything above is theory. Aurono Lab lets you turn it into evidence.
Stress-testing against real black swan events
Here’s the process:
Step 1: Pick a historical crash. Every crypto asset has them. Some examples:
- May 2021 crash - BTC dropped 53% in two weeks
- LUNA/UST collapse (May 2022) - cascading liquidations, 65% BTC drawdown over 6 weeks
- FTX collapse (November 2022) - sudden 25% drop in days, followed by extended bear
- COVID crash (March 2020) - 50% drop in 48 hours, full recovery in 6 months
Step 2: Load the history. In Lab, select your asset and timeframe. Aurono auto-loads historical data from the exchange. For older crashes, use “Load more” to extend your history back far enough.
Step 3: Set your parameters. Enter the buy trigger, sell trigger, amounts, and cooldown you’re considering. Lab shows you how often your trigger would have fired historically, and where those fire points fall on the price chart.
Step 4: Look for these things:
- How many times does the buy trigger fire during the crash? If it’s 20 times and you only have capital for 8 buys, your buy amount is too large or your trigger is too tight.
- Does the sell trigger fire during the recovery? If the sell trigger is 5% and the recovery is a slow grind with only 3% daily bounces, you’ll never sell. Adjust the trigger or the timeframe.
- Where does the cooldown prevent trading? Cooldown gaps during a crash are good - they’re preserving your capital for deeper buys. Cooldown gaps during recovery are bad - they’re delaying your profit-taking.
- What’s the sigma value of your trigger? A trigger at 1 sigma fires frequently (normal volatility). A trigger at 2 sigma fires rarely (only during real stress). For crash protection, your accumulator and catcher layers should be at 2+ sigma.
Step 5: Compare timeframes. Run the same crash period on 1h, 4h, and 1d. Notice how the hourly view shows dozens of triggers while the daily view shows only a handful. This is exactly why the stack works - each layer sees a different reality.
An example: testing against the November 2022 crash
Say you’re setting up an ETH strategy stack. You load ETH-EUR history back to October 2022 in Lab.
Hourly layer test (1h, ~2.6% trigger):
We set up an hourly ETH strategy with drop sensitivity 4 and rise sensitivity 3, covering the FTX crash period (October 2022 - February 2023). Buy amount €12, sell amount €5, starting capital €150.
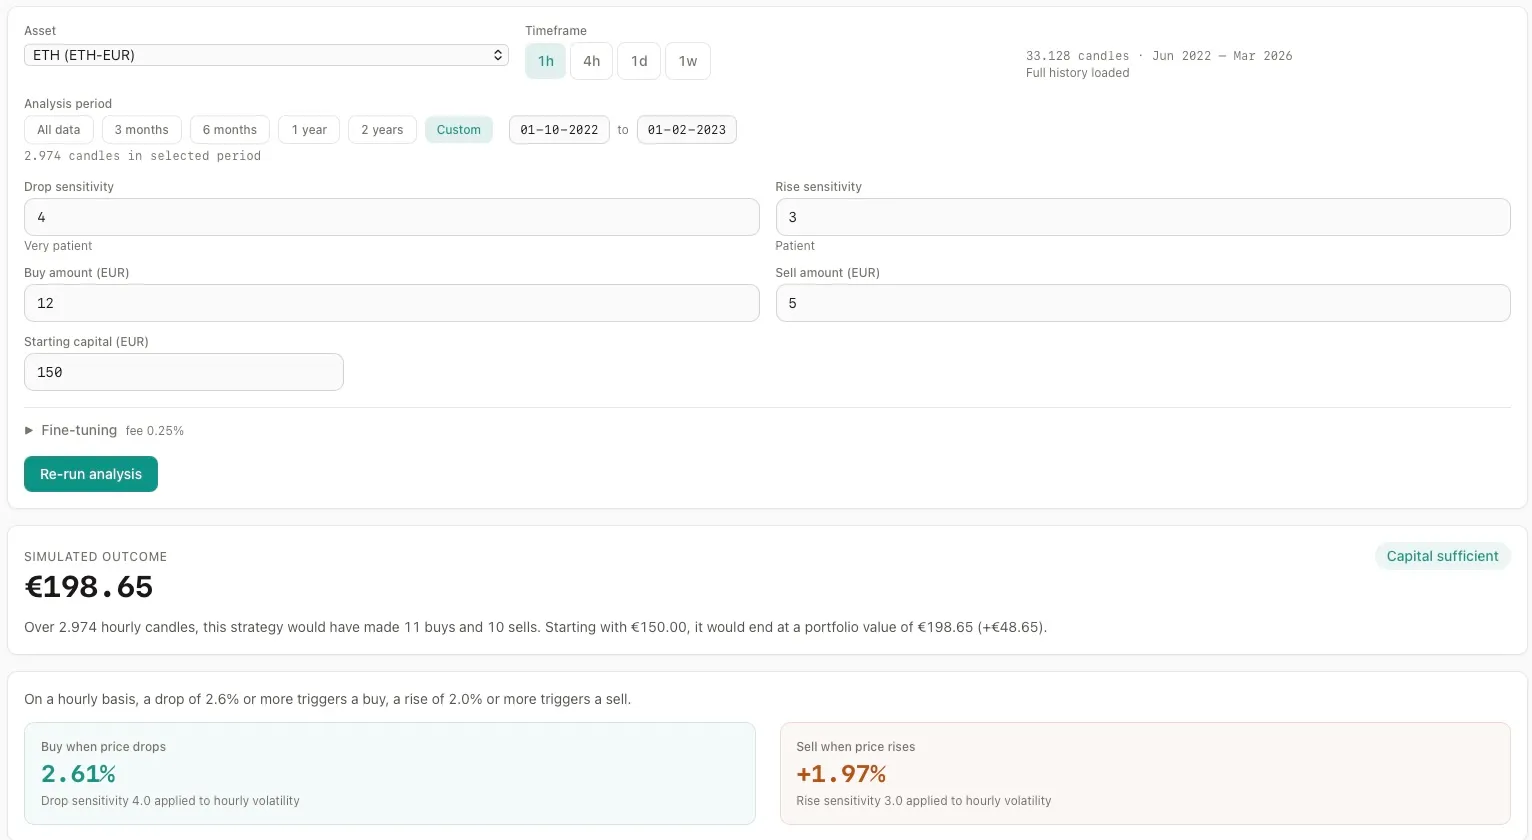
Lab shows 11 buys and 10 sells across the period. Capital was sufficient - at most 75% was deployed at any one time. 14 sells were blocked because the price was below cost. The result: €150 turned into €175.56 (+17%), outperforming both monthly DCA and buy & hold.
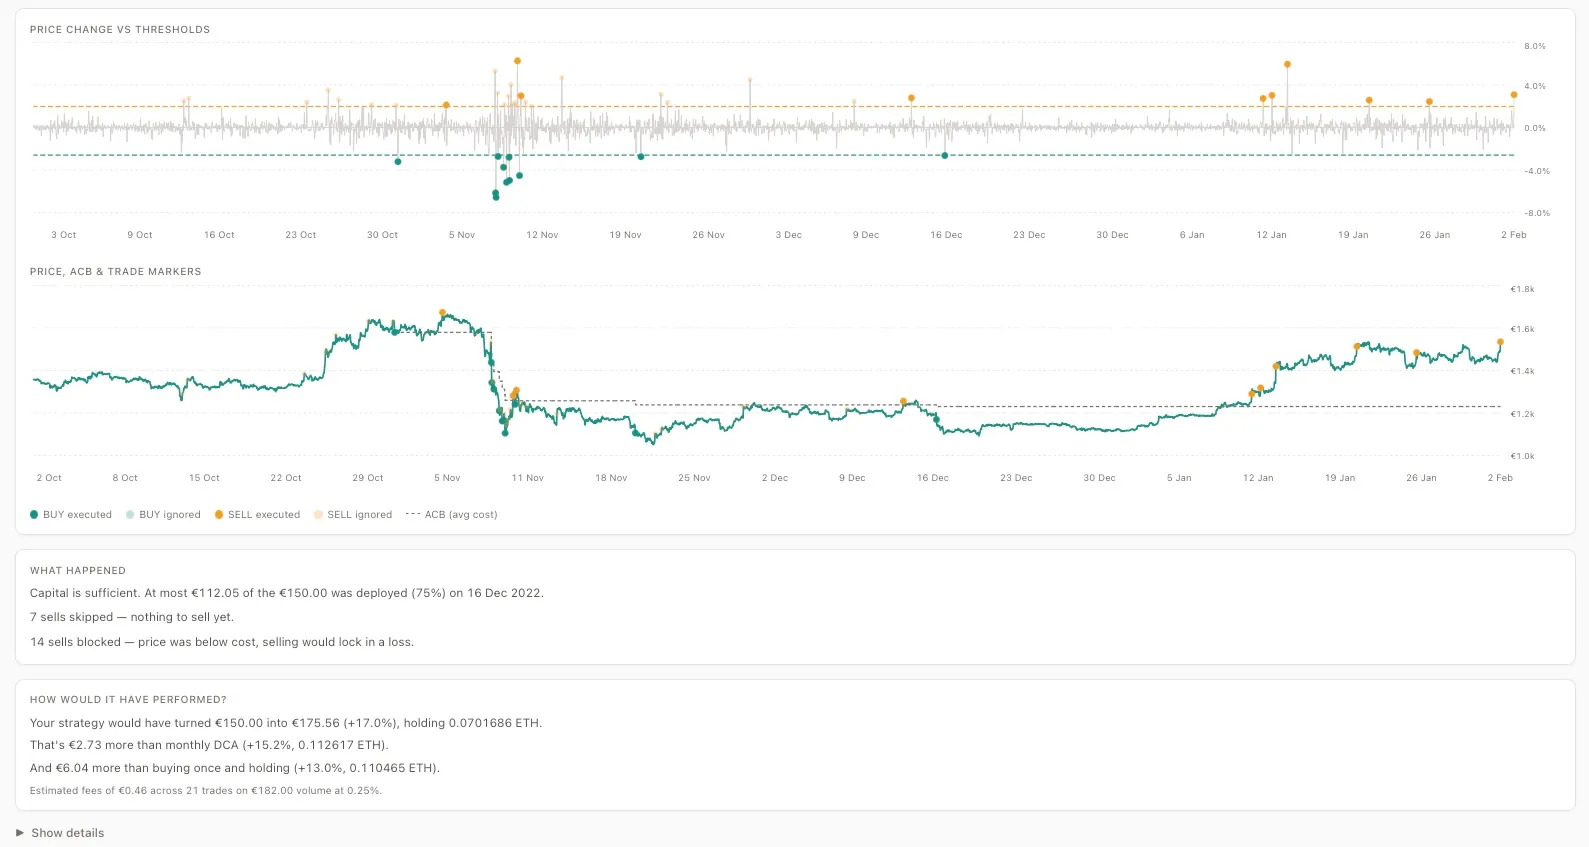
The hourly layer did its job - frequent small trades during the crash, capital recycling during recovery.
Daily layer test (1d, ~10.8% trigger):
Now the slower layer. Daily timeframe, drop sensitivity 3, rise sensitivity 1.5. Larger amounts - €45 per buy, €30 per sell - with €200 starting capital. This time we run it across the full period from January 2022 to March 2026, covering both the crash and the multi-year recovery.
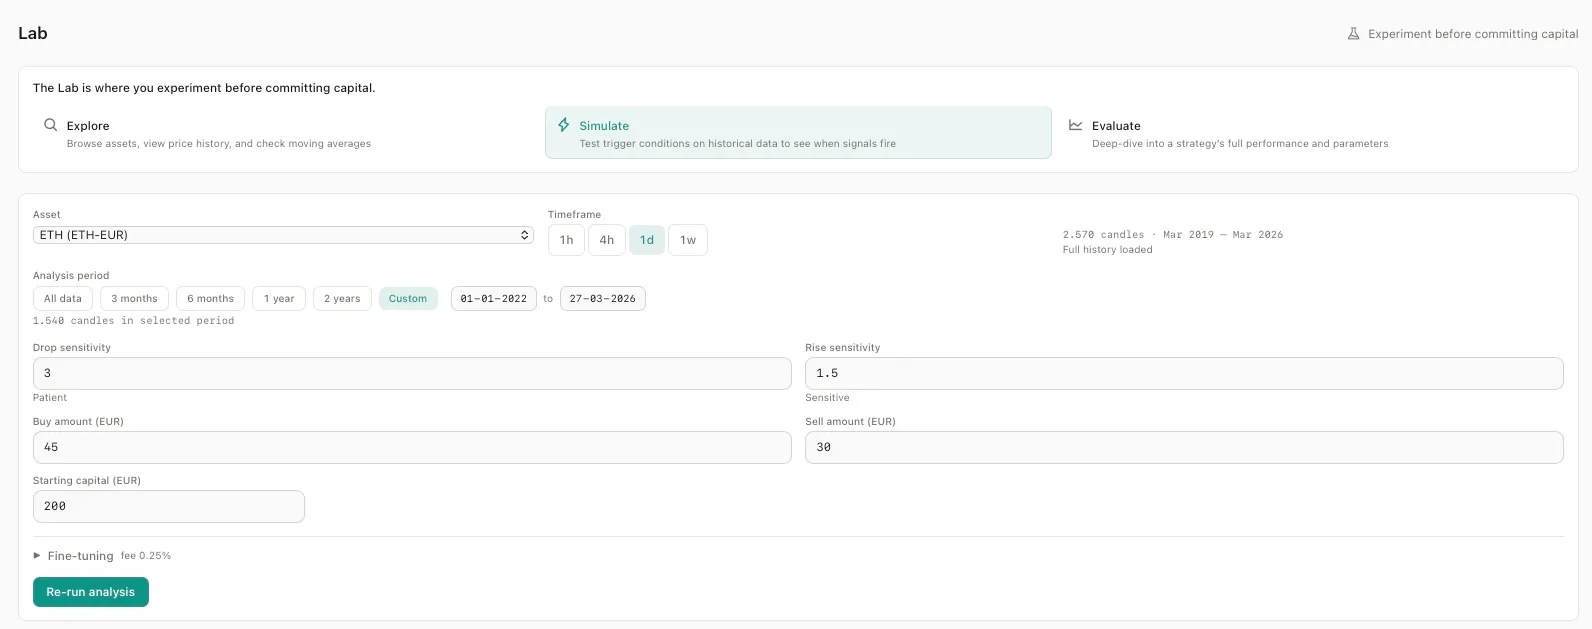
The daily trigger (10.83% drop) fires far less often than the hourly - only during the real drops. 38 sells were skipped (nothing to sell yet) and 23 sells were blocked below cost. But the outcome speaks for itself: €200 turned into €324.51 (+62.3%), beating monthly DCA by €141.80 and buy & hold by €272.48.
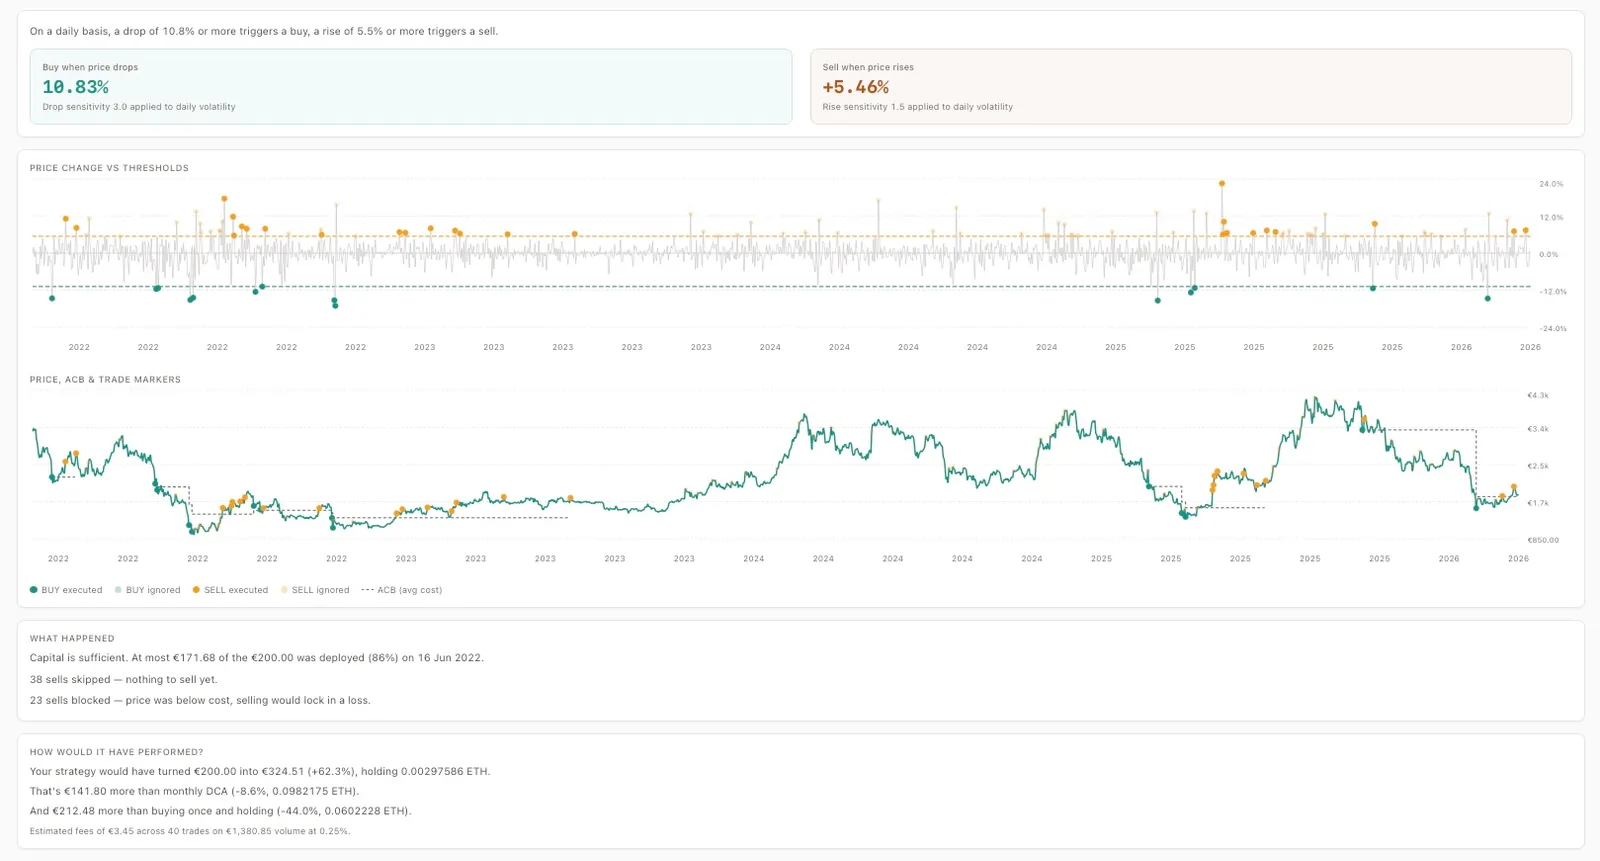
The daily layer bought fewer times, at deeper discounts, and held longer. Combined with the hourly harvester, you’d have had both quick capital recycling and deep-discount accumulation running simultaneously.
Now you have data, not guesses. You know how many trades each layer makes, how much capital it needs, and where the buys land on the price chart.
Putting it into practice
Here’s a checklist for setting up your crash-ready strategy stack:
- Choose your asset - pick something you believe in long-term
- Decide your total capital - how much are you comfortable having at work?
- Split it across layers - hourly (10-15%), 4h (20-25%), daily (30-35%), weekly (25-30%)
- Set triggers per layer - tighter for fast layers, wider for slow layers
- Size buy amounts so each layer can sustain 10+ buys - calculate from the worst crash you can imagine
- Add cooldowns - at least 1 period for hourly, 2-3 for 4h, optional for daily/weekly
- Test in Lab - load a real crash and verify your parameters hold up
- Create the strategies - one per layer, each with its own capital allocation
- Review monthly - are the triggers still calibrated? Has volatility changed?
The market will crash again. You don’t know when, and you don’t know how deep. But with a well-designed strategy stack, tested against real history, you’ll be ready. Not to predict the bottom - nobody can do that - but to deploy capital systematically, at progressively better prices, with rules you trust.
That’s the difference between reacting and being prepared.
Want the docs reference? See Timeframes, Sigma explained, and the Strategy Lab overview.
This is Part 2 of the Protecting Your Strategies series. Read Part 1 for individual setting deep-dives.