
Patience, then harvest: a NEAR case study
In May 2026, a NEAR strategy running on Aurono Start did nothing for weeks. Then, over the course of twelve days, it executed eight trades. Every sell fired near a local peak. Every buy fired near a local trough.
The user did not watch the charts. They did not push any buttons. They did not know in advance which days the trades would land on. They had set the rules once, weeks earlier, and the rules did the rest.
This is a case study in what that actually looks like.
What we’re looking at
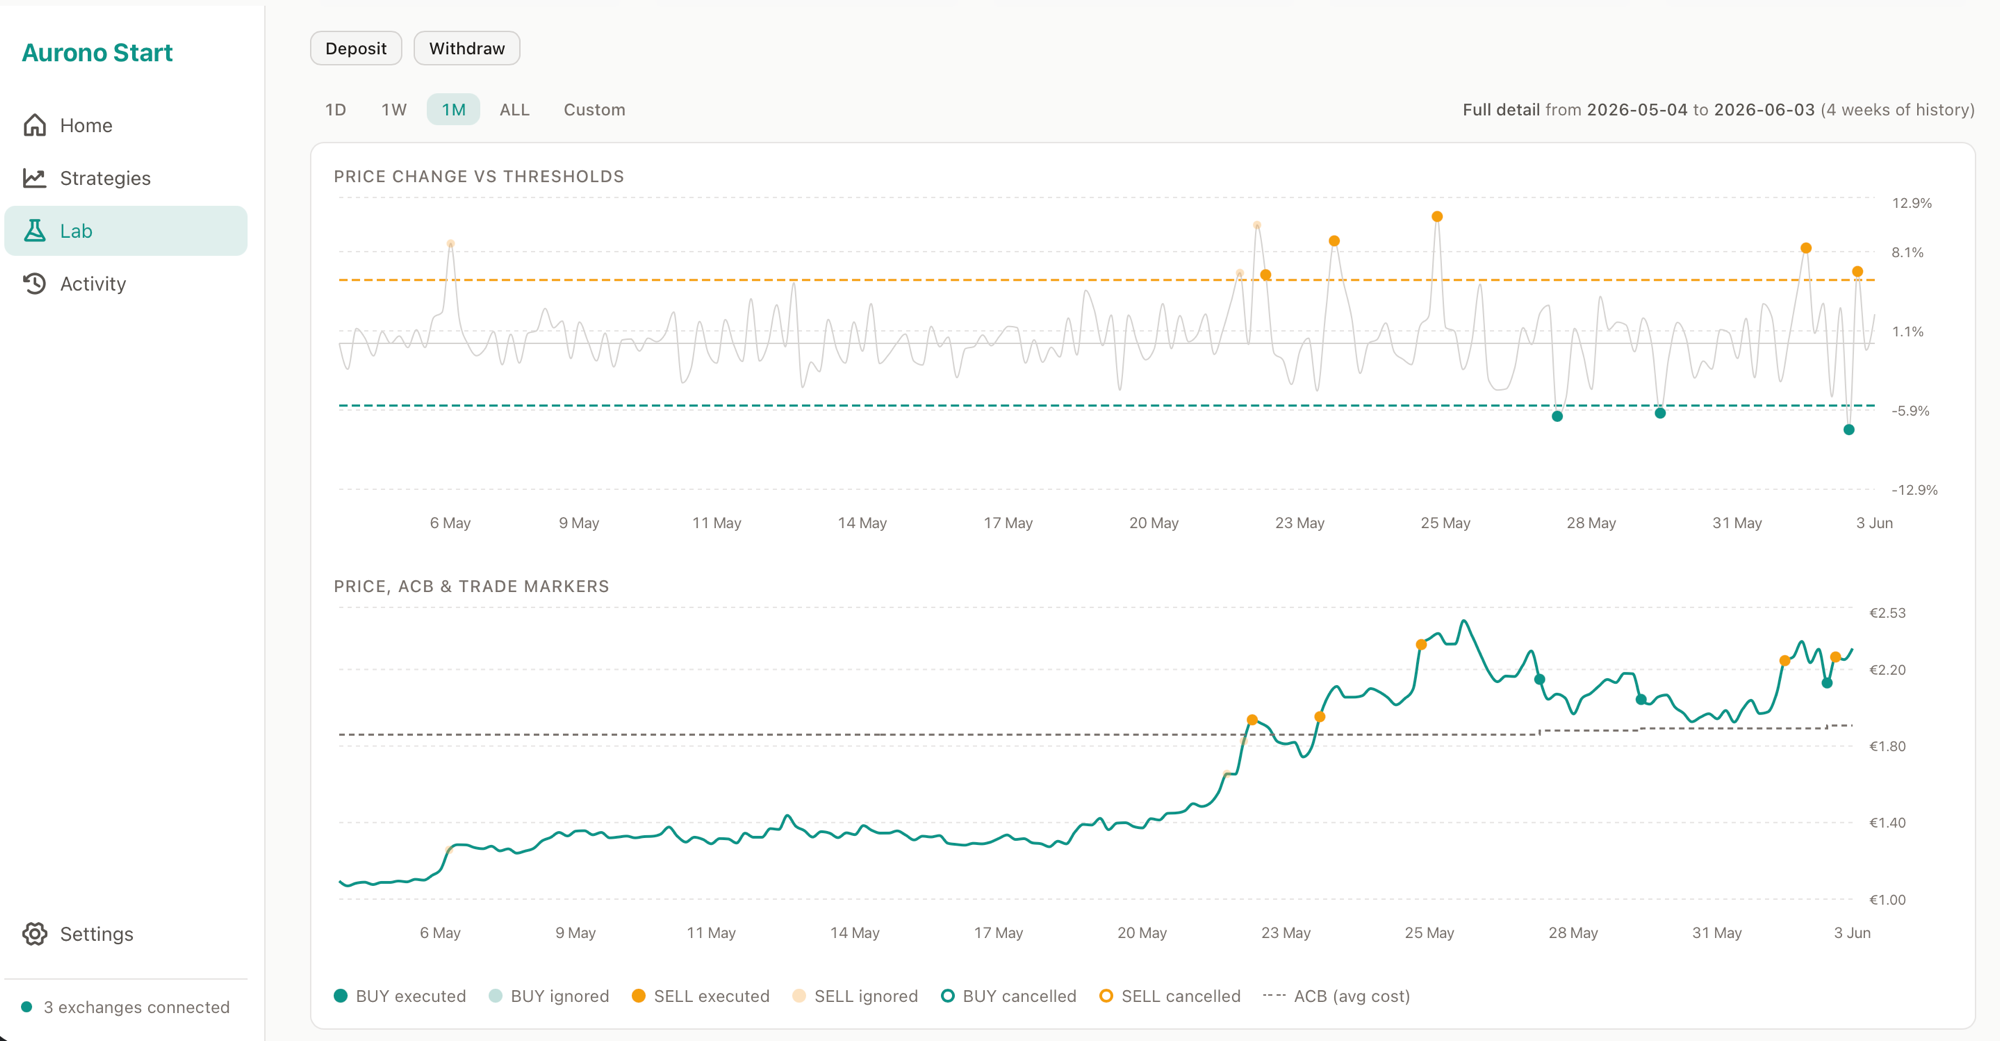
The top chart shows the 4-hour price change against the strategy’s two trigger thresholds - a sell threshold at +5.6% (orange dashed line) and a buy threshold at −5.5% (teal dashed line). The dots above and below those lines are the moments the strategy noticed a signal.
The bottom chart shows the same period in absolute price terms. The teal line is NEAR’s price in EUR on Kraken. The dashed grey line is the strategy’s ACB - its average cost basis, anchored at strategy creation by the starting position. The coloured dots on the price line are the actual trade executions.
The setup
The user defined this NEAR-EUR strategy at the start of May with four things:
- A starting position, which fixed the initial ACB at roughly €1.85.
- A 4-hour evaluation cycle on Kraken - every four hours, the strategy checks the price change since the last check.
- A sell trigger that fires when the 4-hour change crosses +5.6%.
- A buy trigger that fires when the 4-hour change drops below −5.5%.
That is the whole rule set. The buy and sell amounts were configured equal - the strategy is not trying to accumulate or distribute, only to harvest the difference between buying low and selling high.
Phase 1 - Waiting (early May)
For the first three weeks of May, NEAR traded between €1.00 and €1.40 - well below the ACB. Sell signals did fire on the 4-hour windows where NEAR jumped above +5.6%; you can see those as the faint markers in the top chart.
None of them executed.
That is the ACB Guard at work. Aurono Start does not sell below your average cost basis - ever. The signal was real, the rule was firing exactly as configured. But selling NEAR at €1.20 when the ACB was €1.85 would have realised a loss, so the guard blocked it. The blocked trade was recorded in the event log, and the position was left alone.
For someone watching this in real time, three weeks of “nothing happening” can be hard to sit through. For the strategy, three weeks of “nothing happening” was exactly the right behaviour.
Phase 2 - Activation (21-25 May)
Around 21 May, NEAR broke above €1.85 and crossed the ACB. The next sell signal that fired was no longer blocked.
| Date (GMT+2) | Side | Price |
|---|---|---|
| 2026-05-22 10:02 | SELL | €1.9297 |
| 2026-05-23 18:02 | SELL | €1.9539 |
| 2026-05-25 18:02 | SELL | €2.3176 |
Three sells in four days, each one above the previous. The strategy was taking profit as NEAR climbed toward the late-May peak around €2.50.
The user did not press a button. No notification said “the market is rising, consider selling.” The rule said “on a 4-hour window with +5.6% or more, sell,” and on three such windows, it sold.
Phase 3 - Buying back the dips (28 May - 2 June)
After the late-May peak, NEAR pulled back. The lower threshold started getting hit. Buy signals fired.
| Date (GMT+2) | Side | Price |
|---|---|---|
| 2026-05-28 02:02 | BUY | €2.1561 |
| 2026-05-30 02:02 | BUY | €2.0360 |
| 2026-06-01 22:02 | SELL | €2.2349 |
| 2026-06-02 18:02 | BUY | €2.1110 |
| 2026-06-02 22:02 | SELL | €2.2594 |
The 02:02 timestamps are interesting on their own. They sit on the strategy’s 4-hour evaluation grid - 02:02, 06:02, 10:02, 14:02, 18:02, 22:02 - every trade in the audit trail lands on one of those slots. Both of the 02:02 buys happened in the middle of the night, Europe time. The user was asleep. The rule wasn’t.
The last three rows show continued harvesting in compressed time: sell at €2.23 on 1 June, buy back at €2.11 the next afternoon, sell again at €2.26 four hours later. Three trades inside thirty hours, all within a €2.11 - €2.26 band.
What the strategy actually did
Across twelve days, with no intervention from the user:
- Five sells. Every one above the ACB. After activation, the ACB Guard never had to block another sell - the strategy simply waited until prices crossed the threshold before firing.
- Three buys. Each one below the average sell price. The strategy did not predict where NEAR would bottom - it acted when the daily change crossed the user’s lower threshold, and reduced its average entry as it did.
- Average sell price: ~€2.14. Average buy price: ~€2.10. That gap, repeated across many cycles, is the volatility harvest. No directional prediction required.
- Zero overnight worry. Two of the eight trades fired between 02:00 and 04:00 local time. Four fired after 18:00. None required attention.
The strategy does not claim to have called the top or the bottom. It claims to have done exactly what the user wrote down, on every 4-hour window the market gave it a signal. That is the product promise.
What you didn’t see in this case study
A subscription dashboard nagging the user to “consider rebalancing.” A push notification at 2 AM asking “are you watching?” A panicked email suggesting an override during a dip. Aurono Start has none of those things, on purpose.
The point of writing rules down is so a machine can execute them without anyone having to feel anything about it.
Curious how a rule set like this would have performed across multiple years of historical data? The Strategy Lab runs the same logic against any window you choose, before any real money moves. It is how you find out whether your rule has a cadence you can live with - long before activation day.