
Pick a side of the moving average
A price trigger measures one thing: how far the price moved since the last closed candle. A 6% drop on a coin that has doubled this year and a 6% drop on a coin that has halved this year look the same to the trigger. Both moves are the same size, so both moves fire the same buy.
For most of the year that is fine. A strategy that buys drops and sells rises does not need to know the bigger picture to do its job. But some investors want the bigger picture in the rule as well, and the latest release of Aurono Start adds a way to write that into a strategy.
What a moving average adds
A moving average is the average closing price over the last so many candles. On a daily strategy, the 50-day average is the average close of the last 50 days, and every new day the oldest close drops out and the newest close comes in. The moving average moves slowly, so the moving average shows where the price has been on average, while the price trigger shows what the price did today.
Comparing the two gives a second piece of context for every signal. A price above its 50-day average has been rising for a while. A price below its 50-day average has been falling for a while, or has just had a sharp drop.
The new condition
The moving average condition is a new, optional rule you can add to any strategy. You choose a length (MA20, MA50, MA100, MA200, or any other length up to 200 candles) and then a rule for each side:
- At any price: the moving average does not restrict this side
- Only when the price is above it
- Only when the price is below it
Like RSI confirmation, the moving average condition can only hold back a signal the price trigger already produced. The moving average condition never creates a trade on its own. When the condition holds a signal back, the Activity log says so in plain words, for example “price not below its 50-day average”.
The condition is off by default. One click on “Add moving average condition” fills in a starting point: a 50-candle average, buys only below it, sells only above it.
Why the default buys below the trend
There are two classic ways to use a moving average, and the two ways point in opposite directions.
The trend-following way says: only buy while the price is above its average, because a price above its average is in an uptrend. The best-known version is the 200-day average. A strategy built like that sits out bear markets almost entirely.
Aurono strategies work the other way around. An Aurono strategy buys drops and sells rises, and a sharp drop usually takes the price under its average. A rule that only allows buys above the average therefore blocks most of the drops the strategy exists to buy. So the default pairs the moving average with what an Aurono strategy already does:
- Buy only below the average. A drop while the price is still above its 50-day average is a dip inside a rise, and the strategy waits until the price is cheap compared to its recent past, not just compared to yesterday.
- Sell only above the average. A rise while the price is still below its 50-day average is a bounce inside a fall, and the strategy keeps its coins until the price is high compared to its recent past.
Over rising, falling and sideways markets, that pairing stays close to having no condition at all. The pairing trims the trades that go against the trend the strategy is already betting on, and leaves the rest alone.
The trend-following choice is still there if you want it. Choose “Only when the price is above it” for buys, and the form shows a note under the field: the strategy then sits out falling markets, with far fewer buys and no buying on the way down in a crash. For some investors that is exactly the point.
When two conditions cancel each other out
The moving average condition and RSI confirmation can be combined, and the combination can quietly switch a strategy off.
RSI at 30 or below means the recent moves were mostly down. After mostly down moves, the price has almost always fallen under its average. A strategy that needs RSI at 30 or below and the price above its 50-day average asks for two things that almost never happen at the same time, and ends up with few or no buys.
The form checks for that combination. When your RSI levels and your moving average rule clash, the form shows “Expect few or no buys” or “Expect few or no sells” before you save. The warning is a heads-up, not a block: if you really want a strategy that almost never buys, Aurono still saves the strategy.
Testing it in the Lab
Lab → Simulate draws the moving average on the price chart, so you can see where the price was above and below the average when each signal fired. The “What happened” summary counts the signals the moving average held back, separately from the signals held back by RSI or by your cost.
We ran the same BTC-EUR daily strategy through Lab → Simulate twice, over the last 705 days, from mid-November 2024 to October 2026: drop and rise sensitivity at 2, €1,500 starting capital, €100 per buy and per sell, a 0.25% exchange fee. The first run had no moving average condition. The second run had the default: MA50, buy below, sell above. The price triggers were the same in both runs.
Without the moving average condition
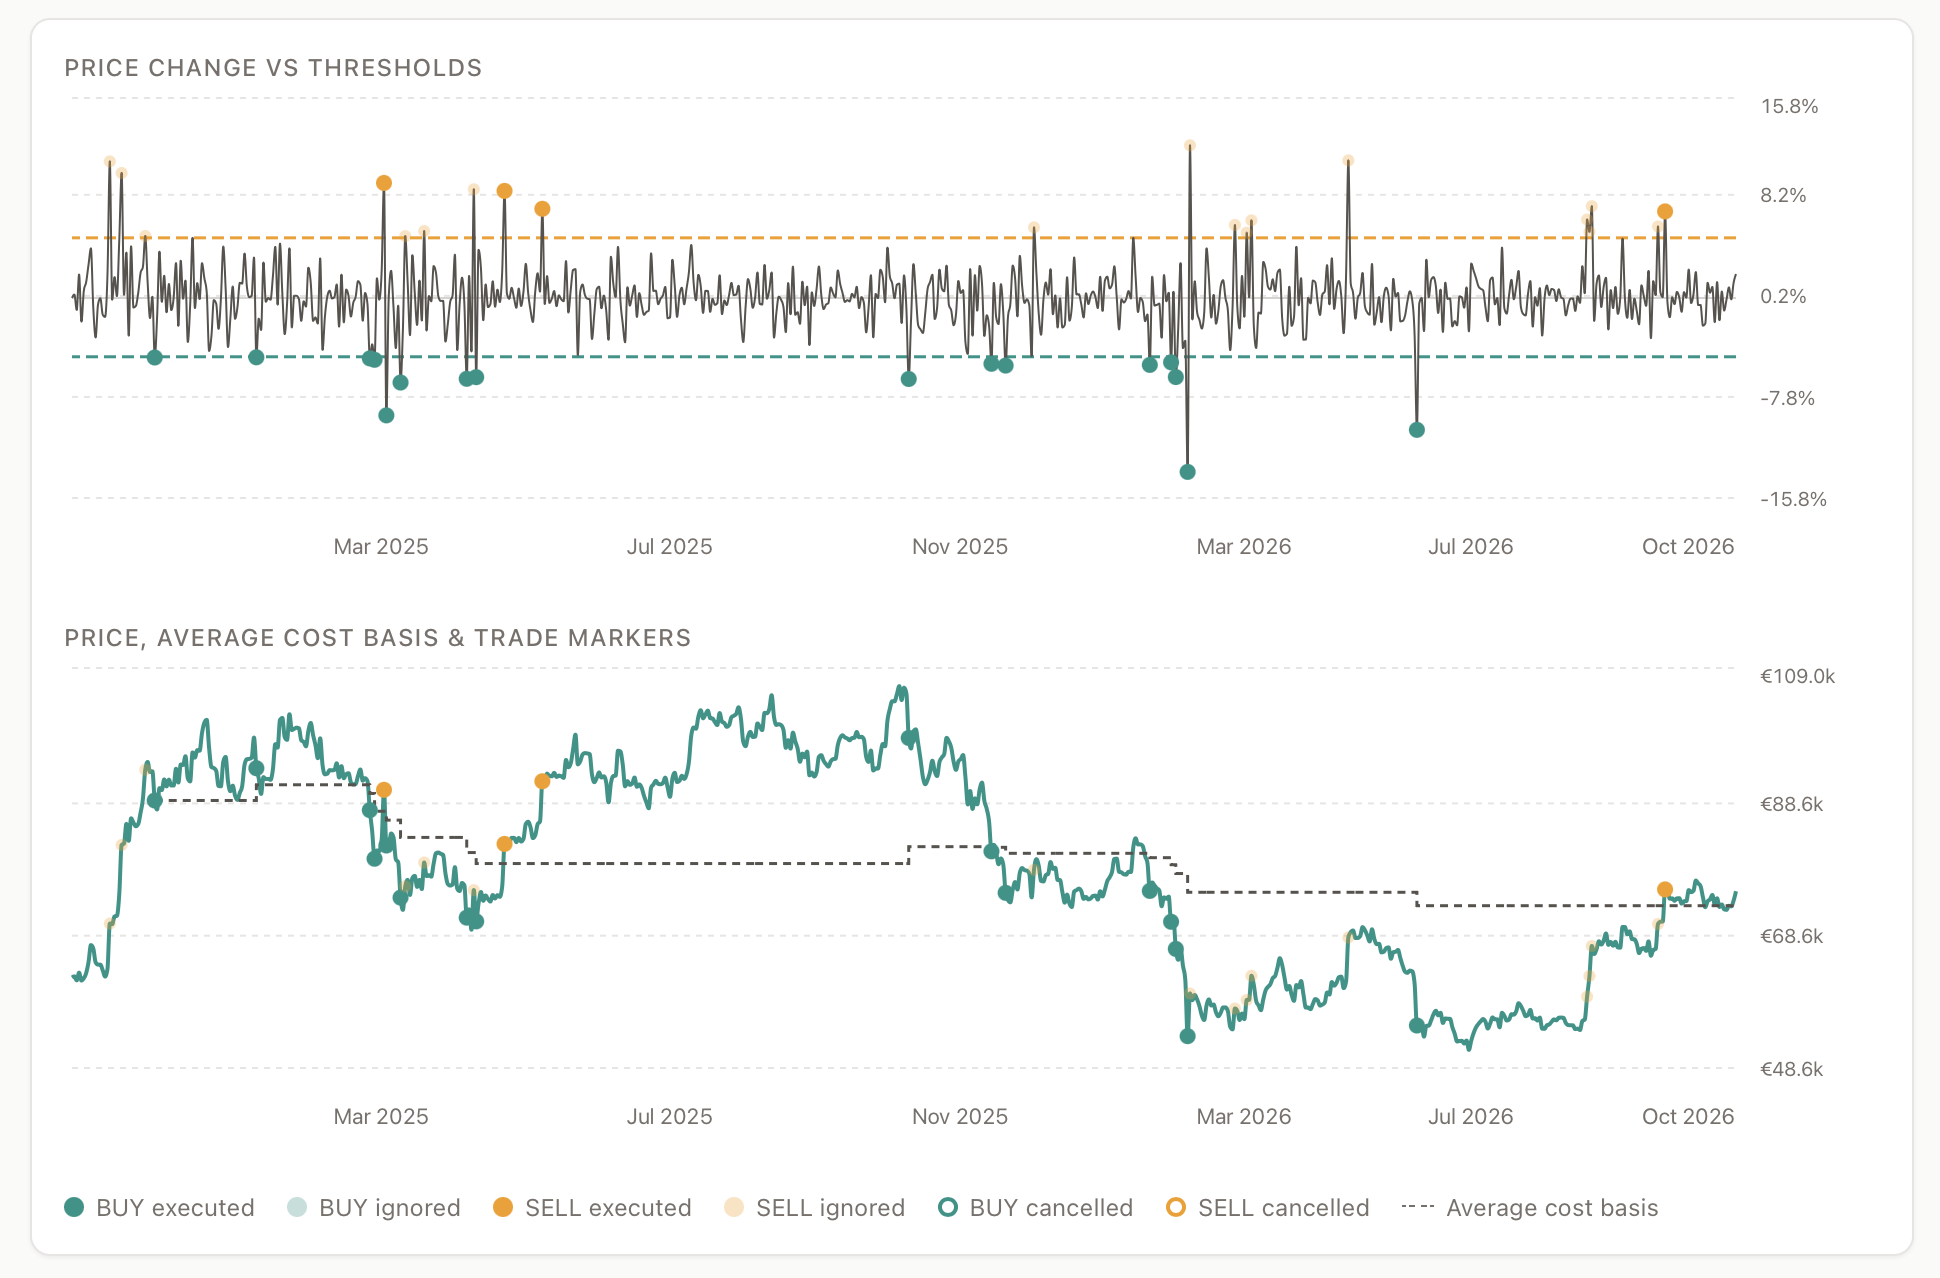
16 buys and 4 sells. The strategy ended at €1,555.52, up 3.7%, which is €37.83 more than buying the same amount every month.
With the moving average condition
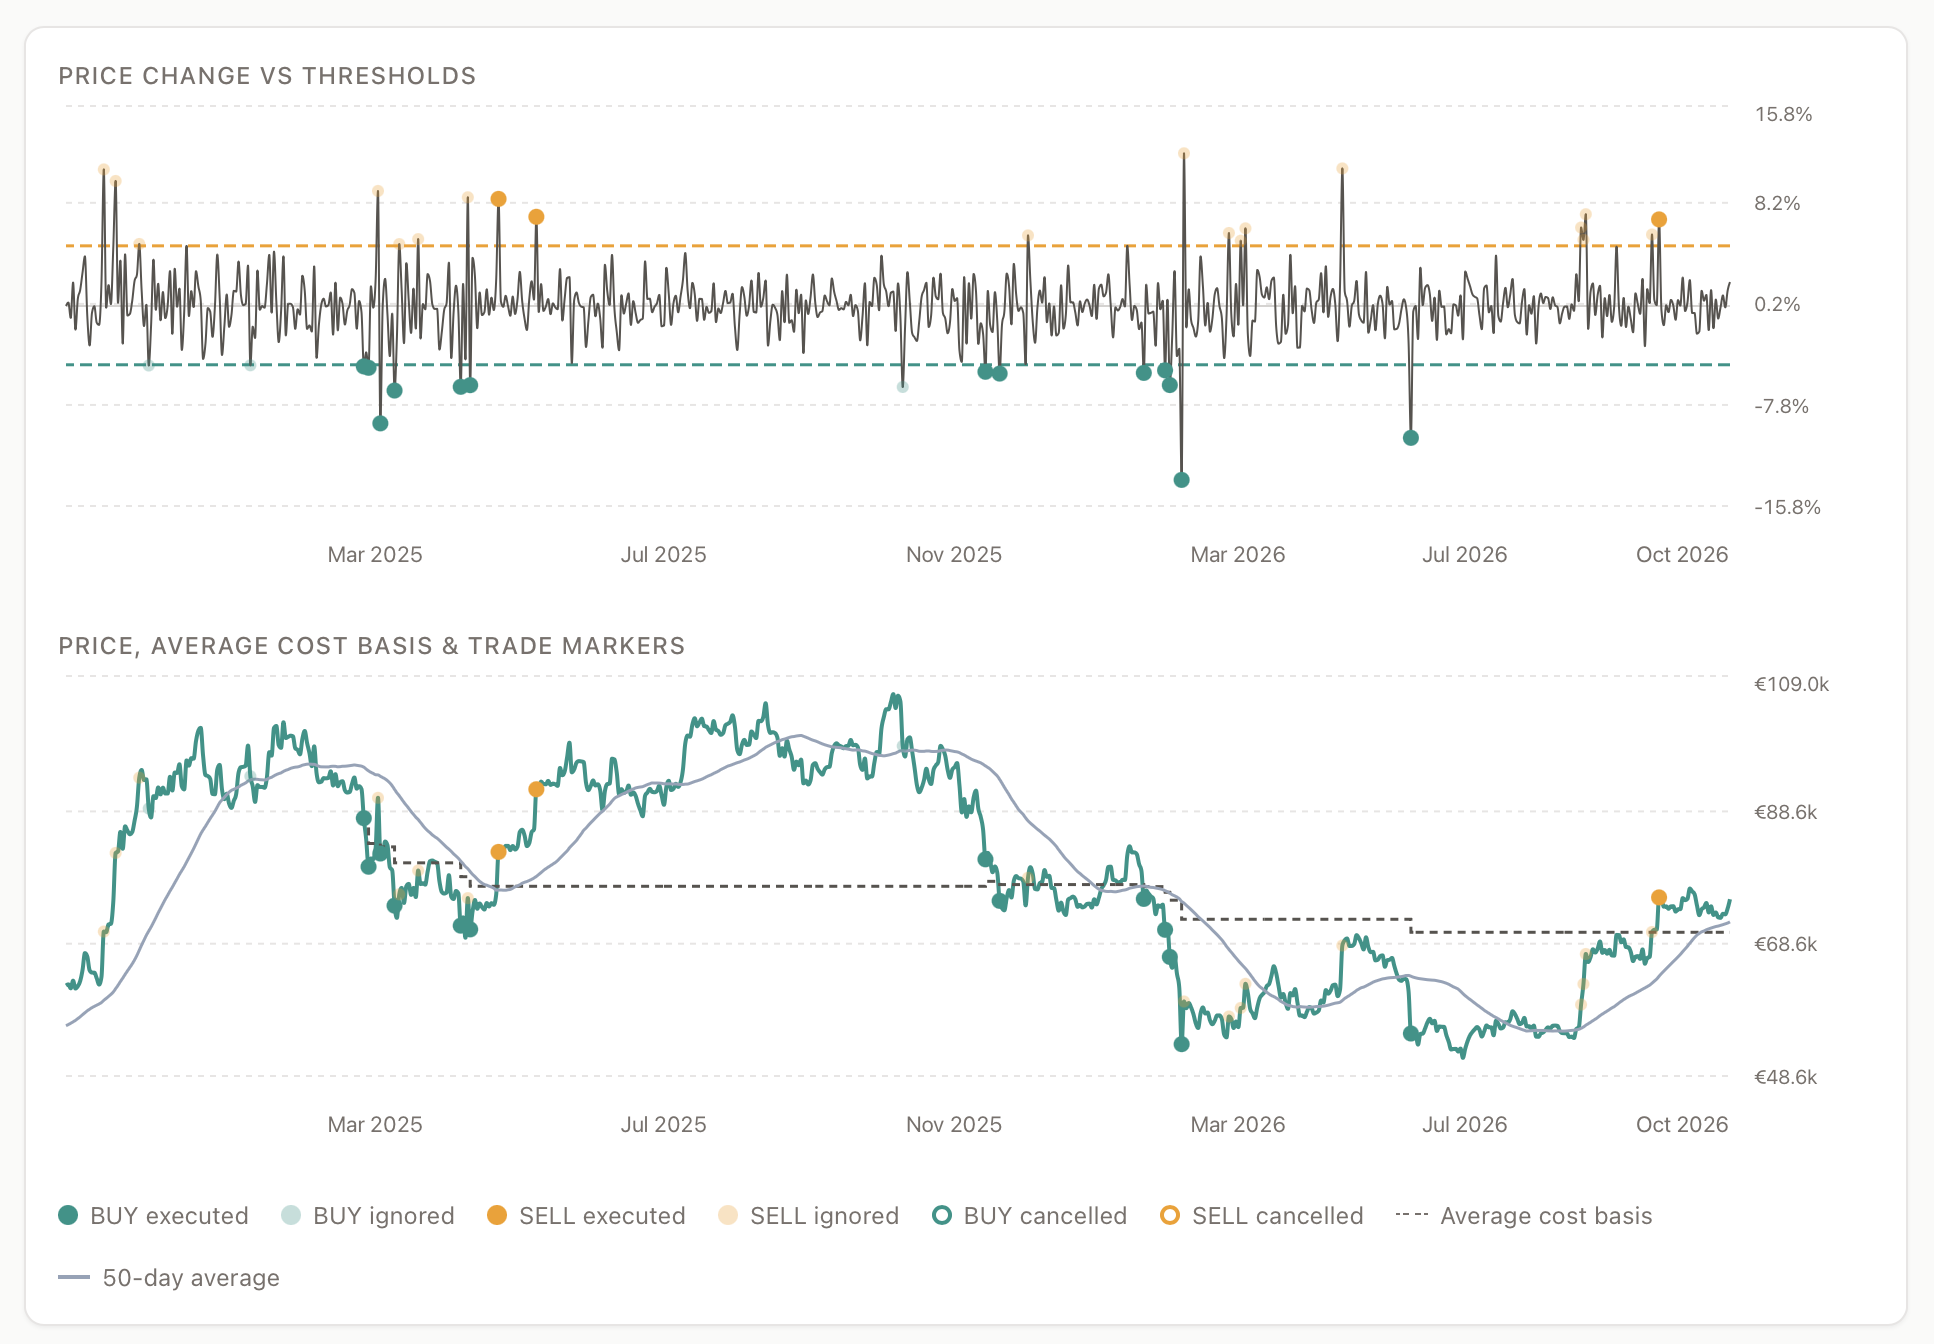
13 buys and 3 sells. The strategy ended at €1,598.22, up 6.5%: €42.70 more than the run without the condition, and €80.53 more than buying every month.
Where the difference comes from
The two runs share almost every trade. The difference sits in four signals, and the 50-day average line in the second chart shows why:
- Three buys held back. On 25 November 2024, 7 January 2025 and 10 October 2025, the price dropped far enough to fire a buy while the price was still above its 50-day average. Without the condition, the strategy bought all three, and those three buys were the most expensive buys of the whole run. With the condition, the strategy waited, and its first buy came in March 2025, after the price had fallen under its average.
- One sell held back. On 2 March 2025, a sharp rise fired a sell at €90,609. The price was above the strategy’s average cost of €83,703, but below its 50-day average of €94,067: a bounce inside a fall. Without the condition, the strategy sold. With the condition, the strategy kept its coins.
- A lower average cost. Without the three buys near the top, the dashed average cost line in the second chart stays lower for the rest of the run, and does not step up in October 2025.
The “What happened” summary of the second run counts 3 buys and 9 sells held back by the average. Most of those 9 sells would not have gone through anyway: in the first run, the same signals were blocked because the price had not cleared cost and fees yet. Only the March 2025 sell actually changed.
Still behind buy-and-hold
Neither run beat buying once and holding. Over these 705 days, €1,500 in BTC on day one and nothing else grew 20.7%, to €1,809.94. A strategy that buys drops and sells rises keeps part of its money in cash, and in a stretch that ends higher than it started, cash is a cost. At its busiest, the strategy with the condition had €1,100.50 of the €1,500 in BTC, 73%.
This is one asset and one period. A choppy year and a trending year can give opposite answers for the same rule. Run the comparison on your own coin and your own period before you add the condition to a live strategy.
One more thing that changed: RSI in the Lab
While building the moving average into Lab → Simulate, we noticed that RSI in the Lab started cold. With an analysis period such as “1 year”, the Lab calculated RSI from the first day of that year only, so RSI had no value for the first two weeks and differed from your live strategy for some weeks after. The Lab now uses the price history before the period for both RSI and the moving average, and matches the live calculation from the first day. Simulations you ran before may show slightly different RSI holds now.
The moving average condition is available in the latest Aurono Start release. Add it from Create Strategy, from a strategy’s edit form, or try it first in Lab → Simulate. The details are in the docs: Moving Average Condition.