
The price came up, the average came down
In August I wrote about an ENA position I had bought by hand, badly, and then handed to an Aurono strategy while the position was down about 66%. That post ended with a promise: leave the strategy running, check again in a few months, and write down whatever the numbers say.
The position is out of the hole. How the position got out is the interesting part, because the price did only half the work.
A tunnel dug from both ends
When the Channel Tunnel was built, crews started digging in England and in France at the same time. Neither crew had to cross the whole distance. Each crew dug towards the other, and the tunnel was finished the day the two crews met.
An underwater position works the same way. There is a gap between two numbers: the price of the coin today, and your average cost, what you paid per coin on average. As long as the price sits below the average cost, you are in the hole. Most people only watch one side of the tunnel, the price, and wait for the price to climb all the way back to what they paid.
There is a second crew. Every time you buy more at a lower price, your average cost comes down. The price digs up from one side, the average cost digs down from the other, and the hole closes when the two meet.
A simple example
Say you bought 100 coins at €3 each. You paid €300. The price falls to €1, so the coins are worth €100. You are 67% down.
Waiting for the price only. The price has to travel from €1 all the way back to €3 before you are even.
Digging from both ends. Now say a rule keeps buying while the price is low, 300 more coins at around €1, another €300. You now hold 400 coins for €600 in total, an average cost of €1.50. The price only has to reach €1.50 to close the hole instead of €3.
Then the price recovers to €2. The 400 coins are worth €800 against the €600 you paid: 33% above your average cost.
Freeze either crew and the hole stays open:
- The price reaches €2, but you never bought more: your average is still €3, and you are 33% down.
- You bought more, but the price stays at €1: your average is €1.50, and you are still 33% down.
Only both movements together get you out. The price had to come up, and the average had to come down.
One honest caveat: buying more only helps if the price does come back at some point. A rule that keeps buying a coin that never recovers only digs the hole deeper. Lowering the average cost shortens the distance the price has to travel. The price still has to travel that distance.
The real example: my ENA position
The same thing happened to my ENA, with messier numbers. Rounded:
- When I handed the position over in April: my average cost was about 30 cents, the price about 10 cents. Down 66%.
- Five months later, on 29 September: the price was about 23 cents, and the strategy’s buying had brought the average cost down to about 14.5 cents. The position was 56% above its average cost.
Freeze either crew again:
- The price at 23 cents with my original 30-cent average: still 24% down.
- The 14.5-cent average with the price stuck at 10 cents: still 29% down.
Neither movement alone was enough. The price more than doubled, and the average cost halved. The two met in the middle, and the position came out on the other side.
The strategy’s own chart in Aurono shows both crews at work. In the lower panel, the dashed line is the average cost, stepping down with every buy. The green line is the price, flat for months and then climbing. The two lines meet in early September, and the first orange sales follow right after.
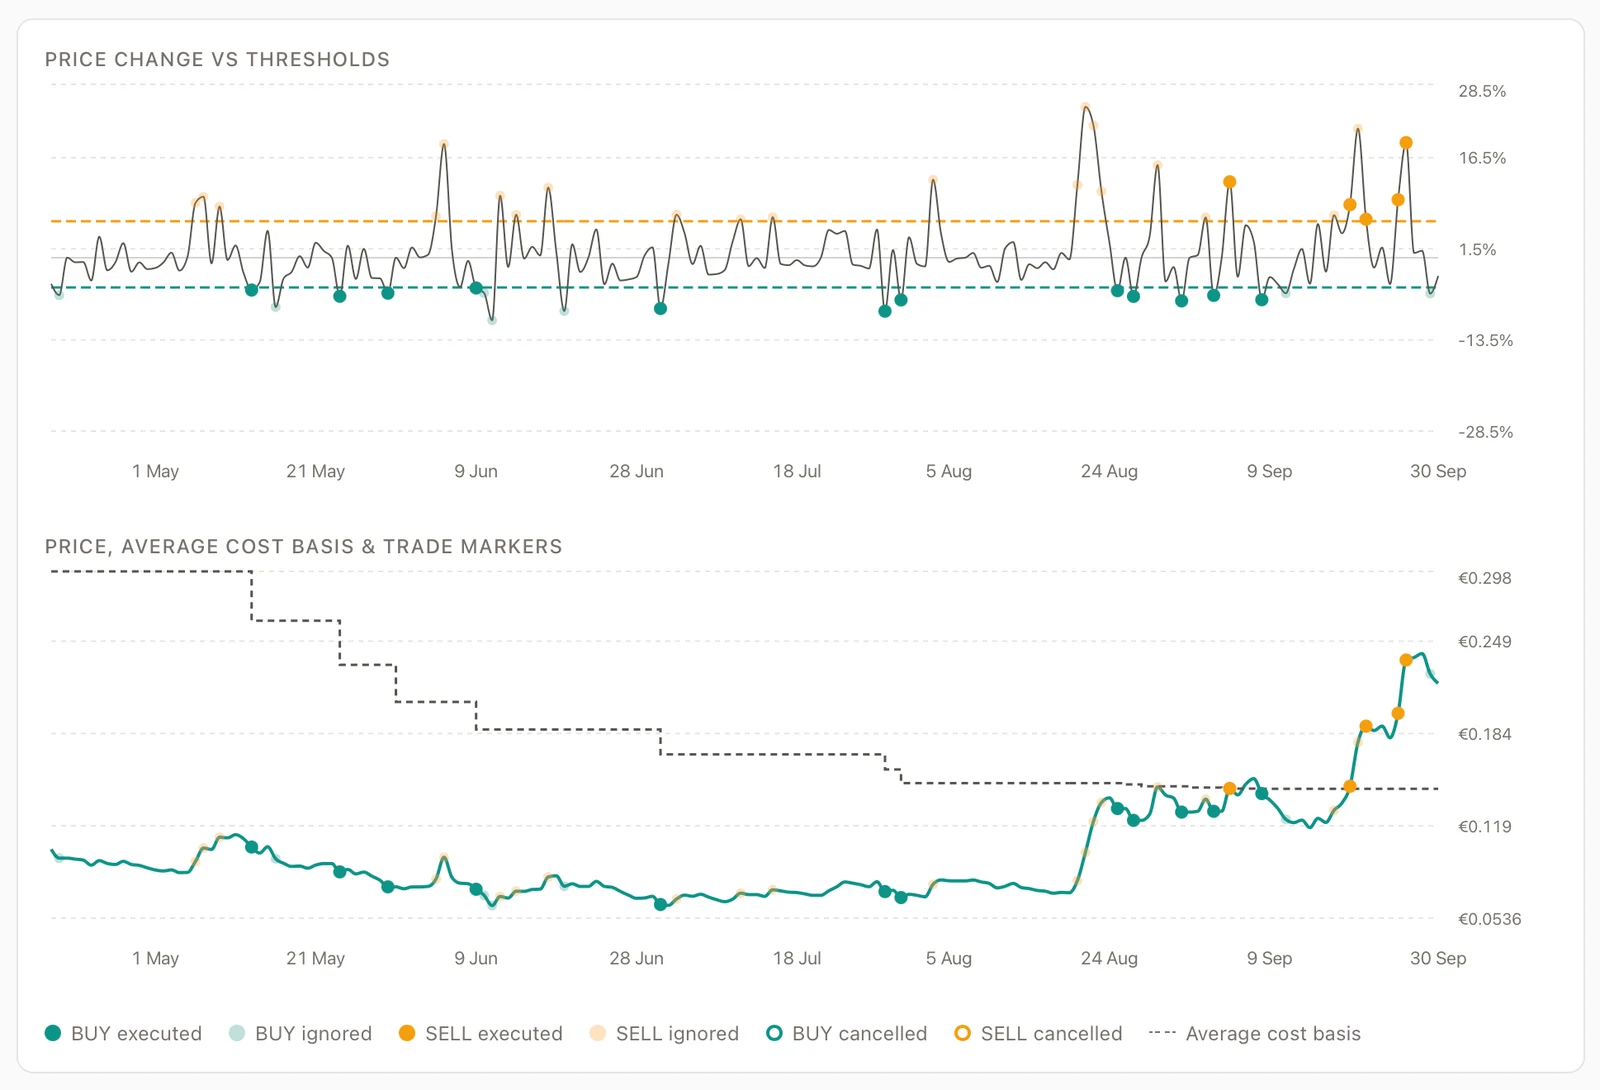
The selling side followed the same logic. For months the strategy wanted to sell and was blocked nineteen times, because every one of those sales would have locked in a loss. When the price finally cleared the average cost in September, the first sales made a few cents each: the earliest permitted sale is by definition close to breakeven. The later ones made a few euros. Five sales so far, all of them profitable. Small amounts on a small position, but the rule that blocked the losing sales is the same rule that let the profitable ones through.
Where the benchmark got it wrong
The August post also quoted Aurono’s comparison against buy-and-hold: the strategy was more than €100 behind simply buying ENA and holding it. That number was wrong, and the reason is easiest to explain with a house.
Say you bought a house at the top of the market, prices crashed, and only then did you hire a contractor to renovate it. You don’t judge the contractor on the value you had already lost before they got the keys. You judge the contractor from the day they got the keys.
Aurono’s comparison did the opposite. The ENA coins I handed over had cost me about €131, but on handover day they were worth about €45. The comparison treated the €131 as money I gave the strategy, so the imaginary buy-and-hold investor got €86 to spend that never existed. Against an opponent funded with money I never had, the strategy was always going to look bad.
Aurono Start v0.1.34 fixed this: inherited coins now count at what they were worth on the day the strategy started, and every euro counts from the day it was added. Measured that way, the strategy finished €17.40 behind buy-and-hold, on a position worth €375.66. Behind by less than 5%, not more than €100. Still behind, and I would rather publish a loss I can check than a win I can’t.
Two questions, two answers
Here is the part that took me longest to see. Judging from the day the keys changed hands is the right way to compare the strategy with buy-and-hold. But the same correction also removes the hole from the accounting. The paper loss I built up before Aurono is no longer counted, so climbing out of that loss isn’t counted either. The benchmark can’t show the one thing that actually happened to my money.
So there are two questions, and they have different answers.
Did the rules beat doing nothing with the same money over the same five months? No. They finished €17.40 behind, in a window where ENA more than doubled and being fully invested was the best place to be. The strategy is also holding €53.55 in cash from its sales, ready for the next dip, where buy-and-hold holds nothing. The score is a snapshot, not a final result.
Did handing over the position do something I couldn’t do myself? Yes, and that is the question I actually care about. I bought ENA in a good mood with no plan, watched the position fall 66%, and reached the point where most people either sell to make the feeling stop or stop opening the app. I did neither, because by then I wasn’t the one making the decisions.
The price came up on its own. The average came down because the strategy kept buying while I wasn’t looking. Two crews, digging from opposite ends, and the tunnel is through.
→ The ENA case study this follows up · Understanding your average cost basis · See how shadow mode tests a strategy for free