RSI Confirmation
RSI confirmation is an optional second condition on top of your price triggers.
With RSI confirmation off, a qualifying price move is enough to allow a trade.
With RSI confirmation on, the price move still has to qualify and momentum has to agree before Aurono is allowed to act.
RSI confirmation is off by default. A strategy created without it behaves exactly as described on the Buy Trigger and Sell Trigger pages.
What RSI Confirmation Adds
Section titled “What RSI Confirmation Adds”When RSI confirmation is configured:
- A buy requires the drop percentage to be met and RSI to be at or below your buy ceiling
- A sell requires the rise percentage to be met and RSI to be at or above your sell floor
In plain terms:
Buy only when price has fallen far enough and recent momentum has been downward. Sell only when price has risen far enough and recent momentum has been upward.
RSI confirmation can only hold a trade back. RSI confirmation never causes a trade on its own.
The Three Settings
Section titled “The Three Settings”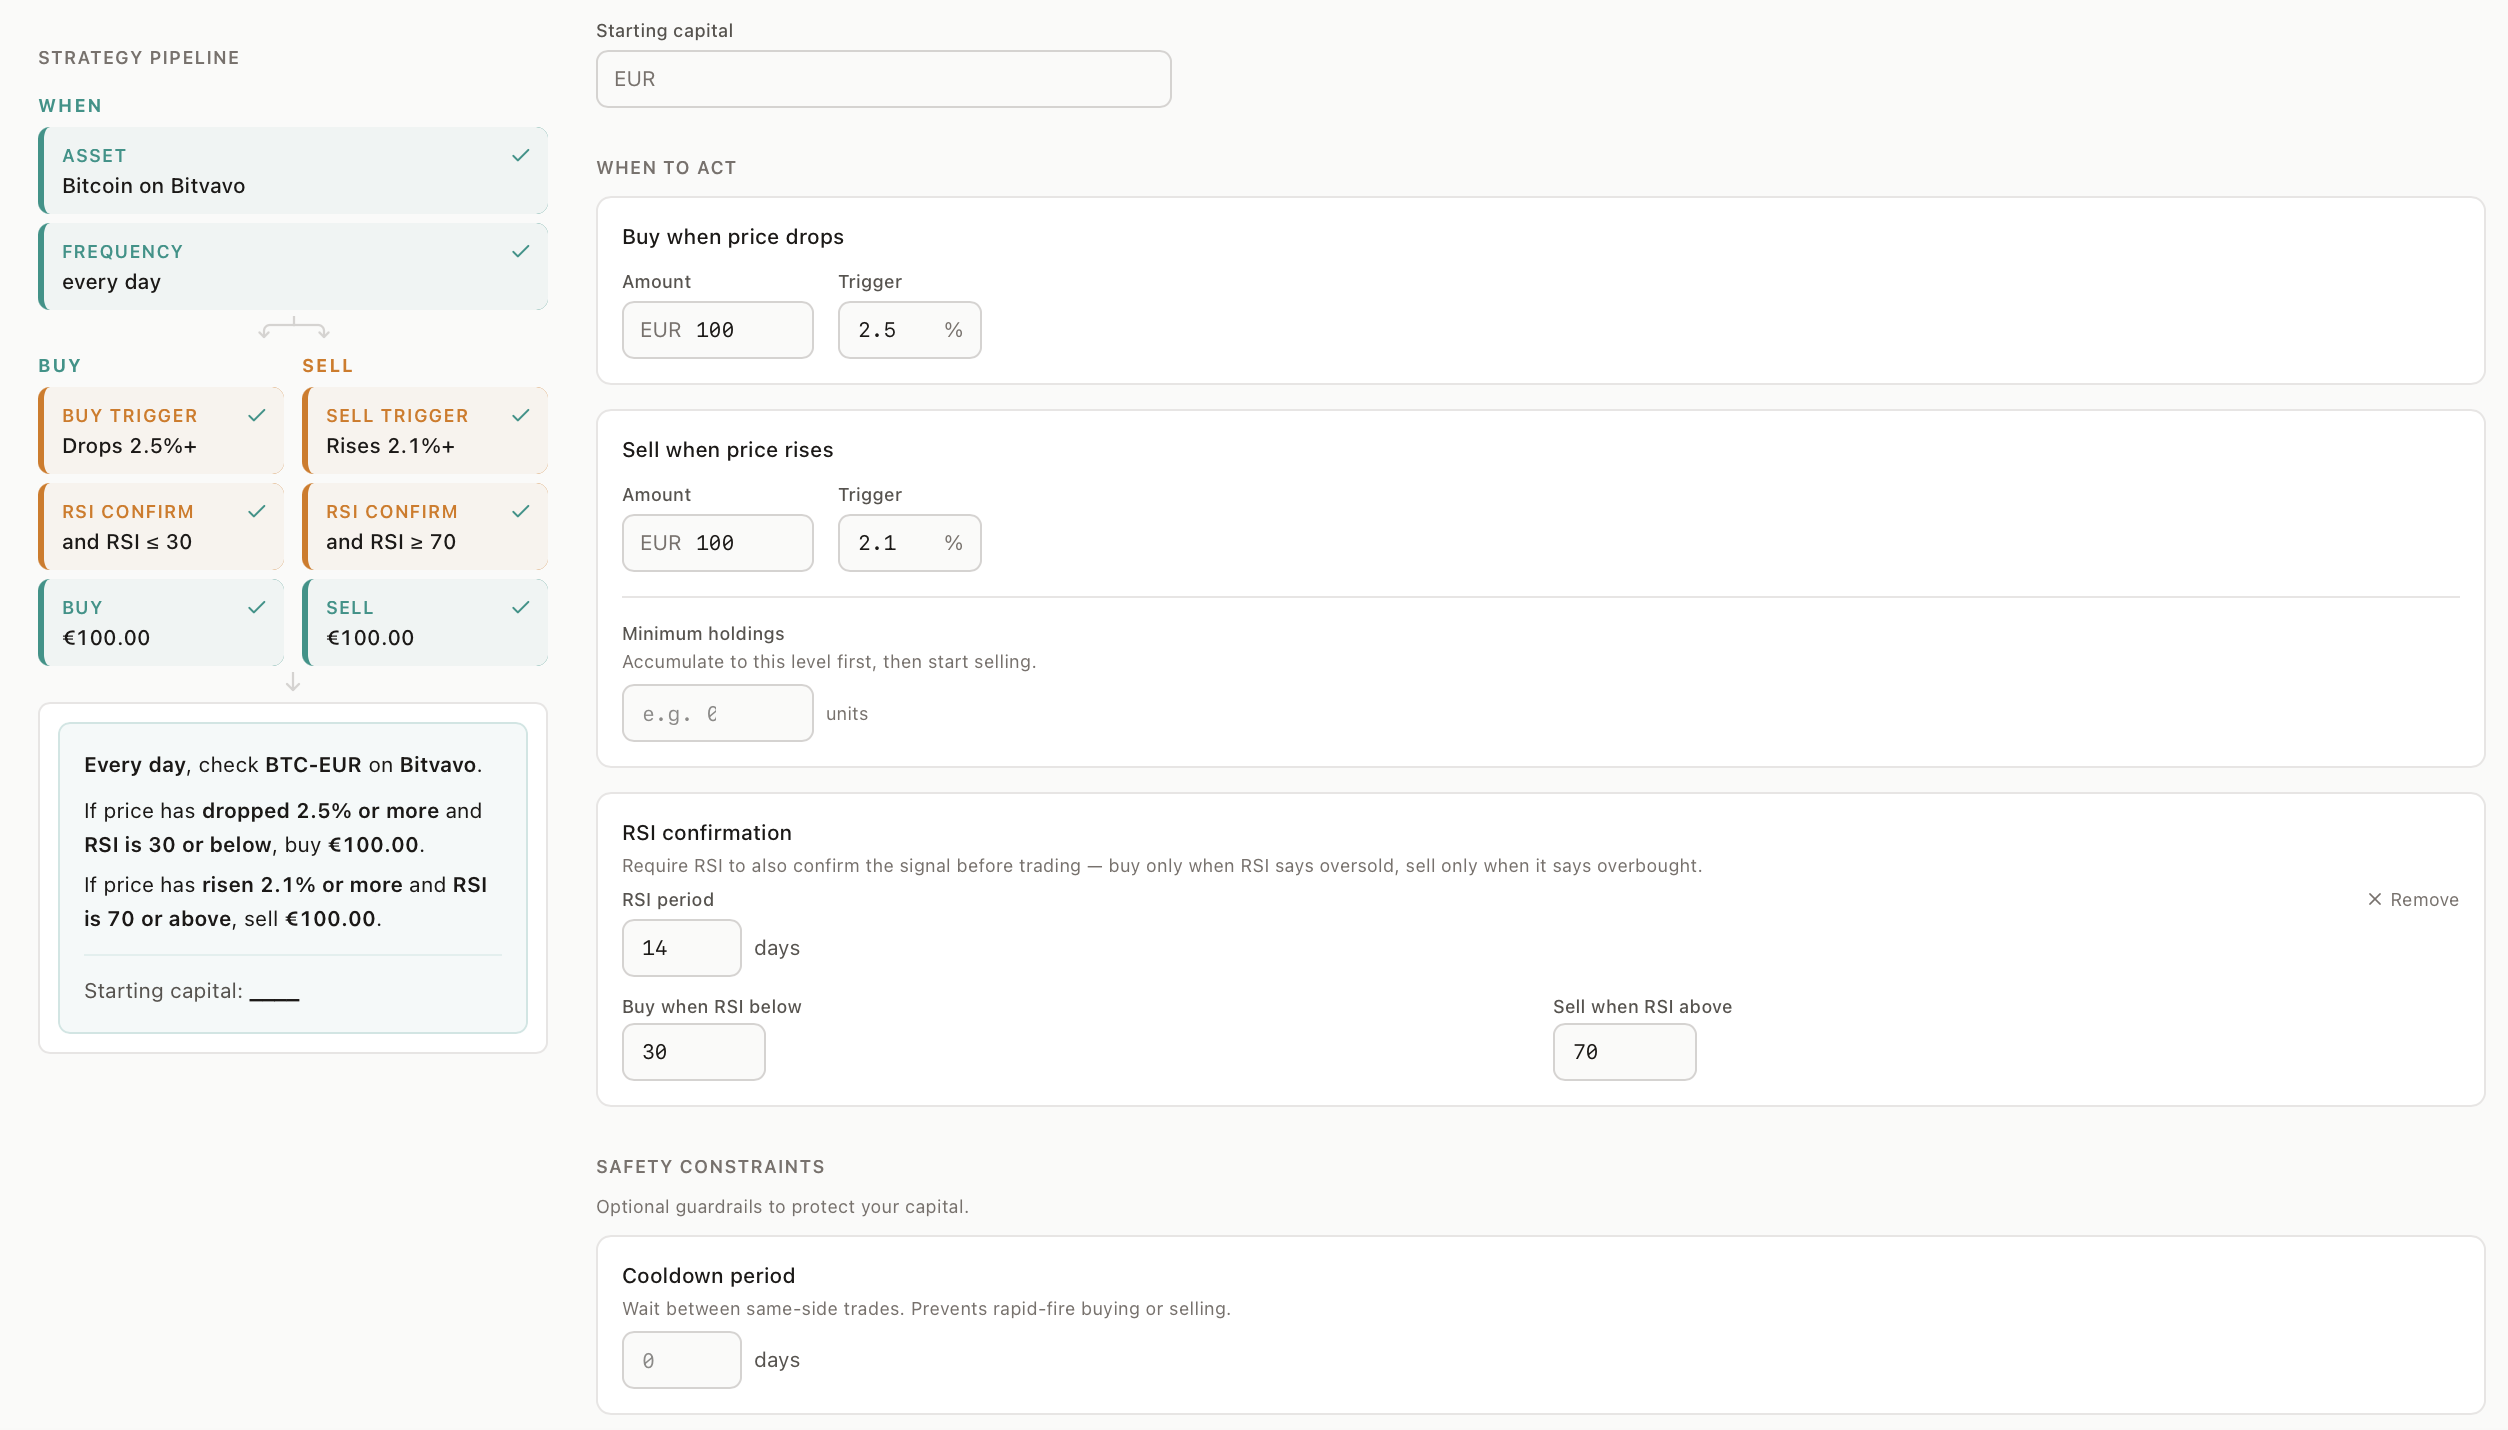
The block sits under When to act, below the buy and sell triggers it applies to.
| Setting | What it controls | Standard value |
|---|---|---|
| RSI period | How many closed candles RSI is calculated over | 14 |
| Buy when RSI below | The buy ceiling. A buy is allowed only at or below this value | 30 |
| Sell when RSI above | The sell floor. A sell is allowed only at or above this value | 70 |
Clicking Add RSI condition fills in 14, 30 and 70 for you. Those values are the widely used convention, not a requirement, and you can change all three.
The RSI period counts in your strategy’s own timeframe, not in days. The unit next to the field says which: the daily strategy above reads 14 days, while a 4h strategy would read 14 4-hour blocks for the same number.
To turn RSI confirmation off again, use the Remove link next to the RSI period field. Removing clears all three values and the condition stops applying.
Where You Can Set It
Section titled “Where You Can Set It”RSI confirmation is available in three places:
- Create Strategy, when defining a new strategy
- Lab Simulate, to test the effect against historical data before committing
- Quick Test, to try values against an existing strategy without changing it
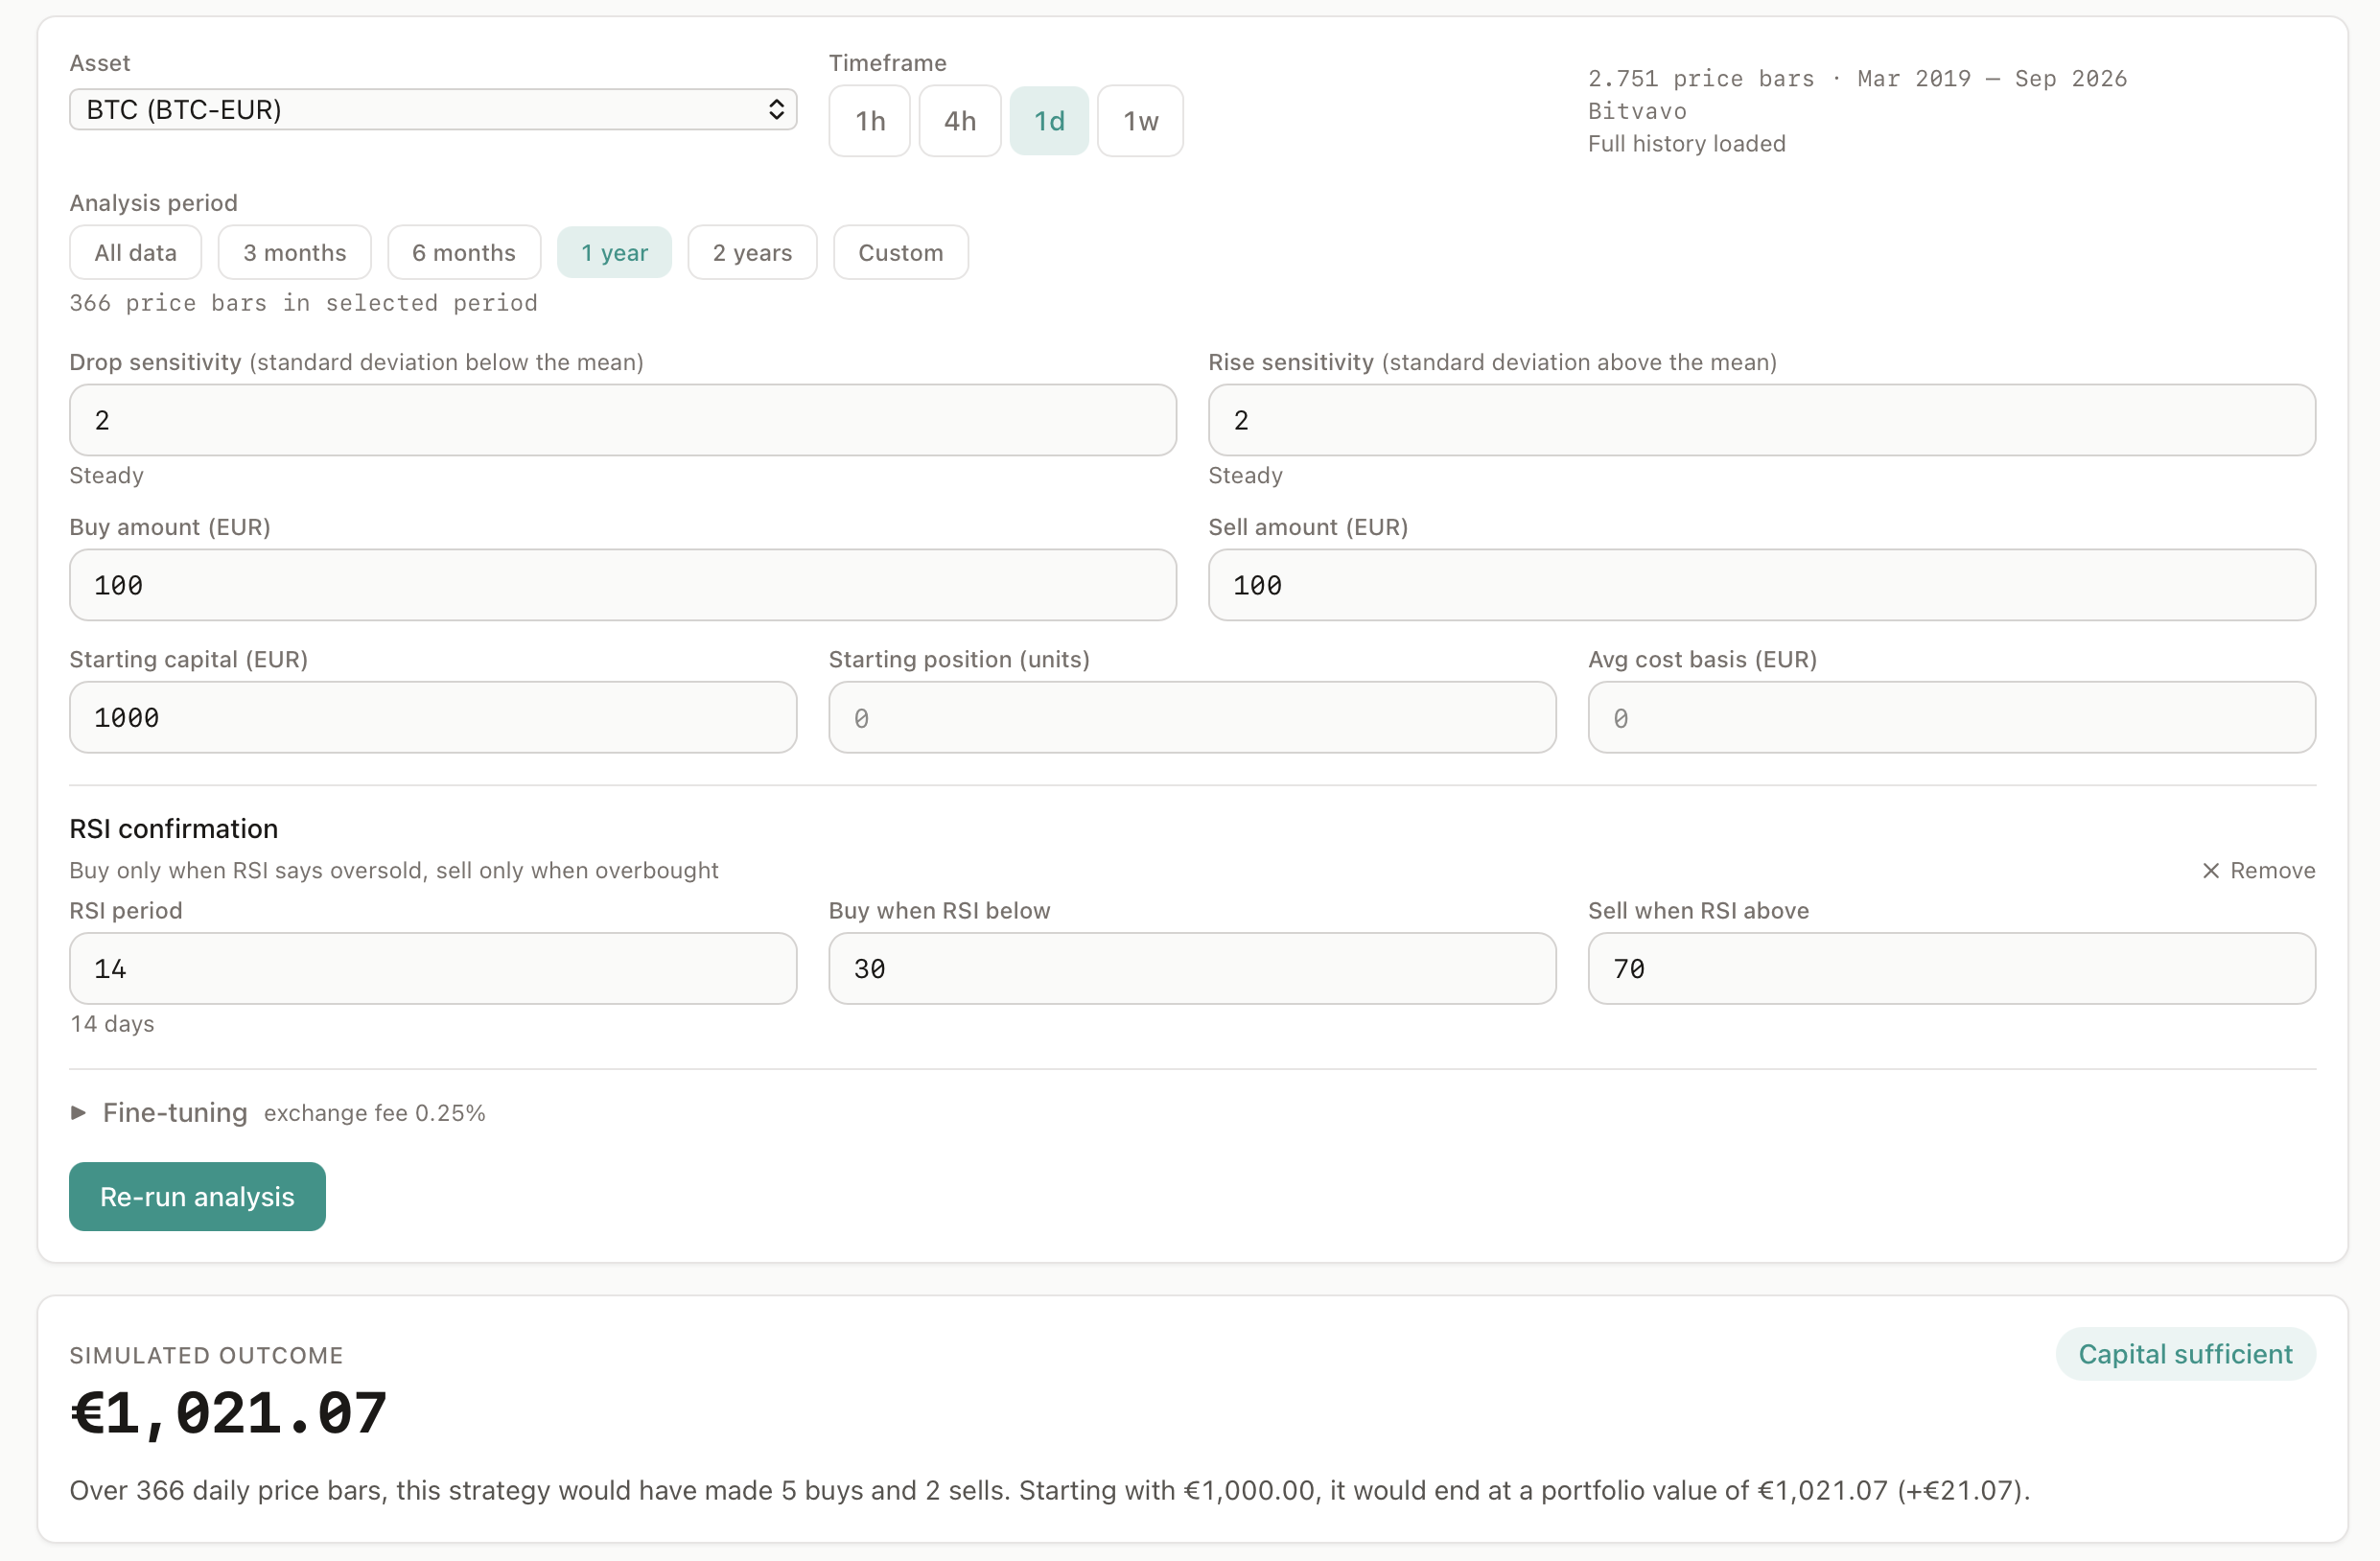
Lab Simulate carries the same three fields, so you can try thresholds against real history before committing to them.
You can also add or change RSI confirmation on an existing strategy. Like every other parameter change, doing so creates a new strategy version rather than editing history.
What the Number Means
Section titled “What the Number Means”RSI (Relative Strength Index) compares the average size of recent up moves against the average size of recent down moves, expressed as a number between 0 and 100.
- A value near 0 means down moves have dominated the period, often called oversold
- A value near 100 means up moves have dominated, often called overbought
- 50 is the balance point, where up moves and down moves cancel out
RSI does not measure price itself. Two assets at completely different prices can report the same RSI value, and price can fall sharply while RSI still sits well above 30.
Aurono calculates RSI using Wilder’s smoothing, the original 1978 method, so values match what other charting tools report for the same candles.
For a longer explanation of what the number is built from and why 30 and 70 became the defaults, see the blog post What RSI actually measures.
Where RSI Sits in the Order of Checks
Section titled “Where RSI Sits in the Order of Checks”This is the part worth understanding, because it determines which reason you see when a trade does not happen.
When a price trigger is met, Aurono evaluates conditions in this fixed order:
- Is this side enabled at all (buy or sell amount above €0)
- RSI confirmation
- Cooldown between same-side trades
- Available capital (buy) or available inventory (sell)
- Average cost base plus the fee-safety margin (sell only)
- Minimum position guard (sell only)
RSI is checked before cooldown, capital, inventory and the average cost base rule.
The practical consequence: when RSI blocks a signal, Aurono reports “RSI not oversold” or “RSI not overbought” and stops there. You will not also see “not enough cash” or “below ACB” for that same signal, even when those were equally true at the time. The first reason shown is always the one that actually blocked the trade.
Not Enough History Yet
Section titled “Not Enough History Yet”RSI needs at least period + 1 closed candles before RSI can produce a value at all.
A brand-new strategy on a slow timeframe may therefore sit through its first few evaluations without trading, because the RSI value is not yet computable. This resolves by itself as candles accumulate.
Settings That Cannot Do What They Look Like They Do
Section titled “Settings That Cannot Do What They Look Like They Do”RSI is mathematically bounded to 0 through 100. A threshold outside that range makes the condition a permanent no-op: a buy ceiling of 120 is passed by every possible RSI value, so the strategy looks RSI-confirmed while RSI never blocks anything.
Aurono flags four cases:
| Setting | Why it is flagged |
|---|---|
| Buy ceiling or sell floor outside 0 to 100 | The condition can never block anything, or can never pass |
| RSI period below 2 | Too short to produce a meaningful average gain and loss |
| Buy ceiling above 50 | Unusually weak. The buy ceiling sits on the upward-momentum side of neutral |
| Sell floor below 50 | Unusually weak. The sell floor sits on the downward-momentum side of neutral |
Lab Simulate and Quick Test warn about all four immediately, because neither has a submit step that would otherwise catch the problem. Create Strategy rejects out-of-range values outright when you submit.
A buy ceiling above 50 or a sell floor below 50 is a warning, not an error. Both remain allowed, on the grounds that a deliberately loose threshold is a legitimate choice.
Seeing RSI in the Interface
Section titled “Seeing RSI in the Interface”Once RSI confirmation is configured, the value shows up wherever your strategy explains itself:
- Lab Simulate draws RSI on the Price Change chart, in two styles you can switch between: “RSI: Bands” shades the background where RSI confirmed the move, “RSI: Filled” draws the RSI curve itself. Your choice is kept for the rest of the session
- The Evaluate tab marks signals that were blocked specifically by RSI, with the RSI value at that moment in the tooltip, and repeats both thresholds in the trigger parameter strip under the verdict (RSI ≤30 / ≥70)
- The Activity log shows the RSI value both on blocked signals and on trades RSI confirmed
- Strategy detail lists the three values as RSI period, RSI buy ceiling and RSI sell floor, and version history shows exactly when the values changed
- The pipeline preview gains an RSI CONFIRM card on each side, and the plain-language summary folds the condition into the sentence: “If price has dropped 2.5% or more and RSI is 30 or below, buy €100.00” (both visible in the screenshot above)
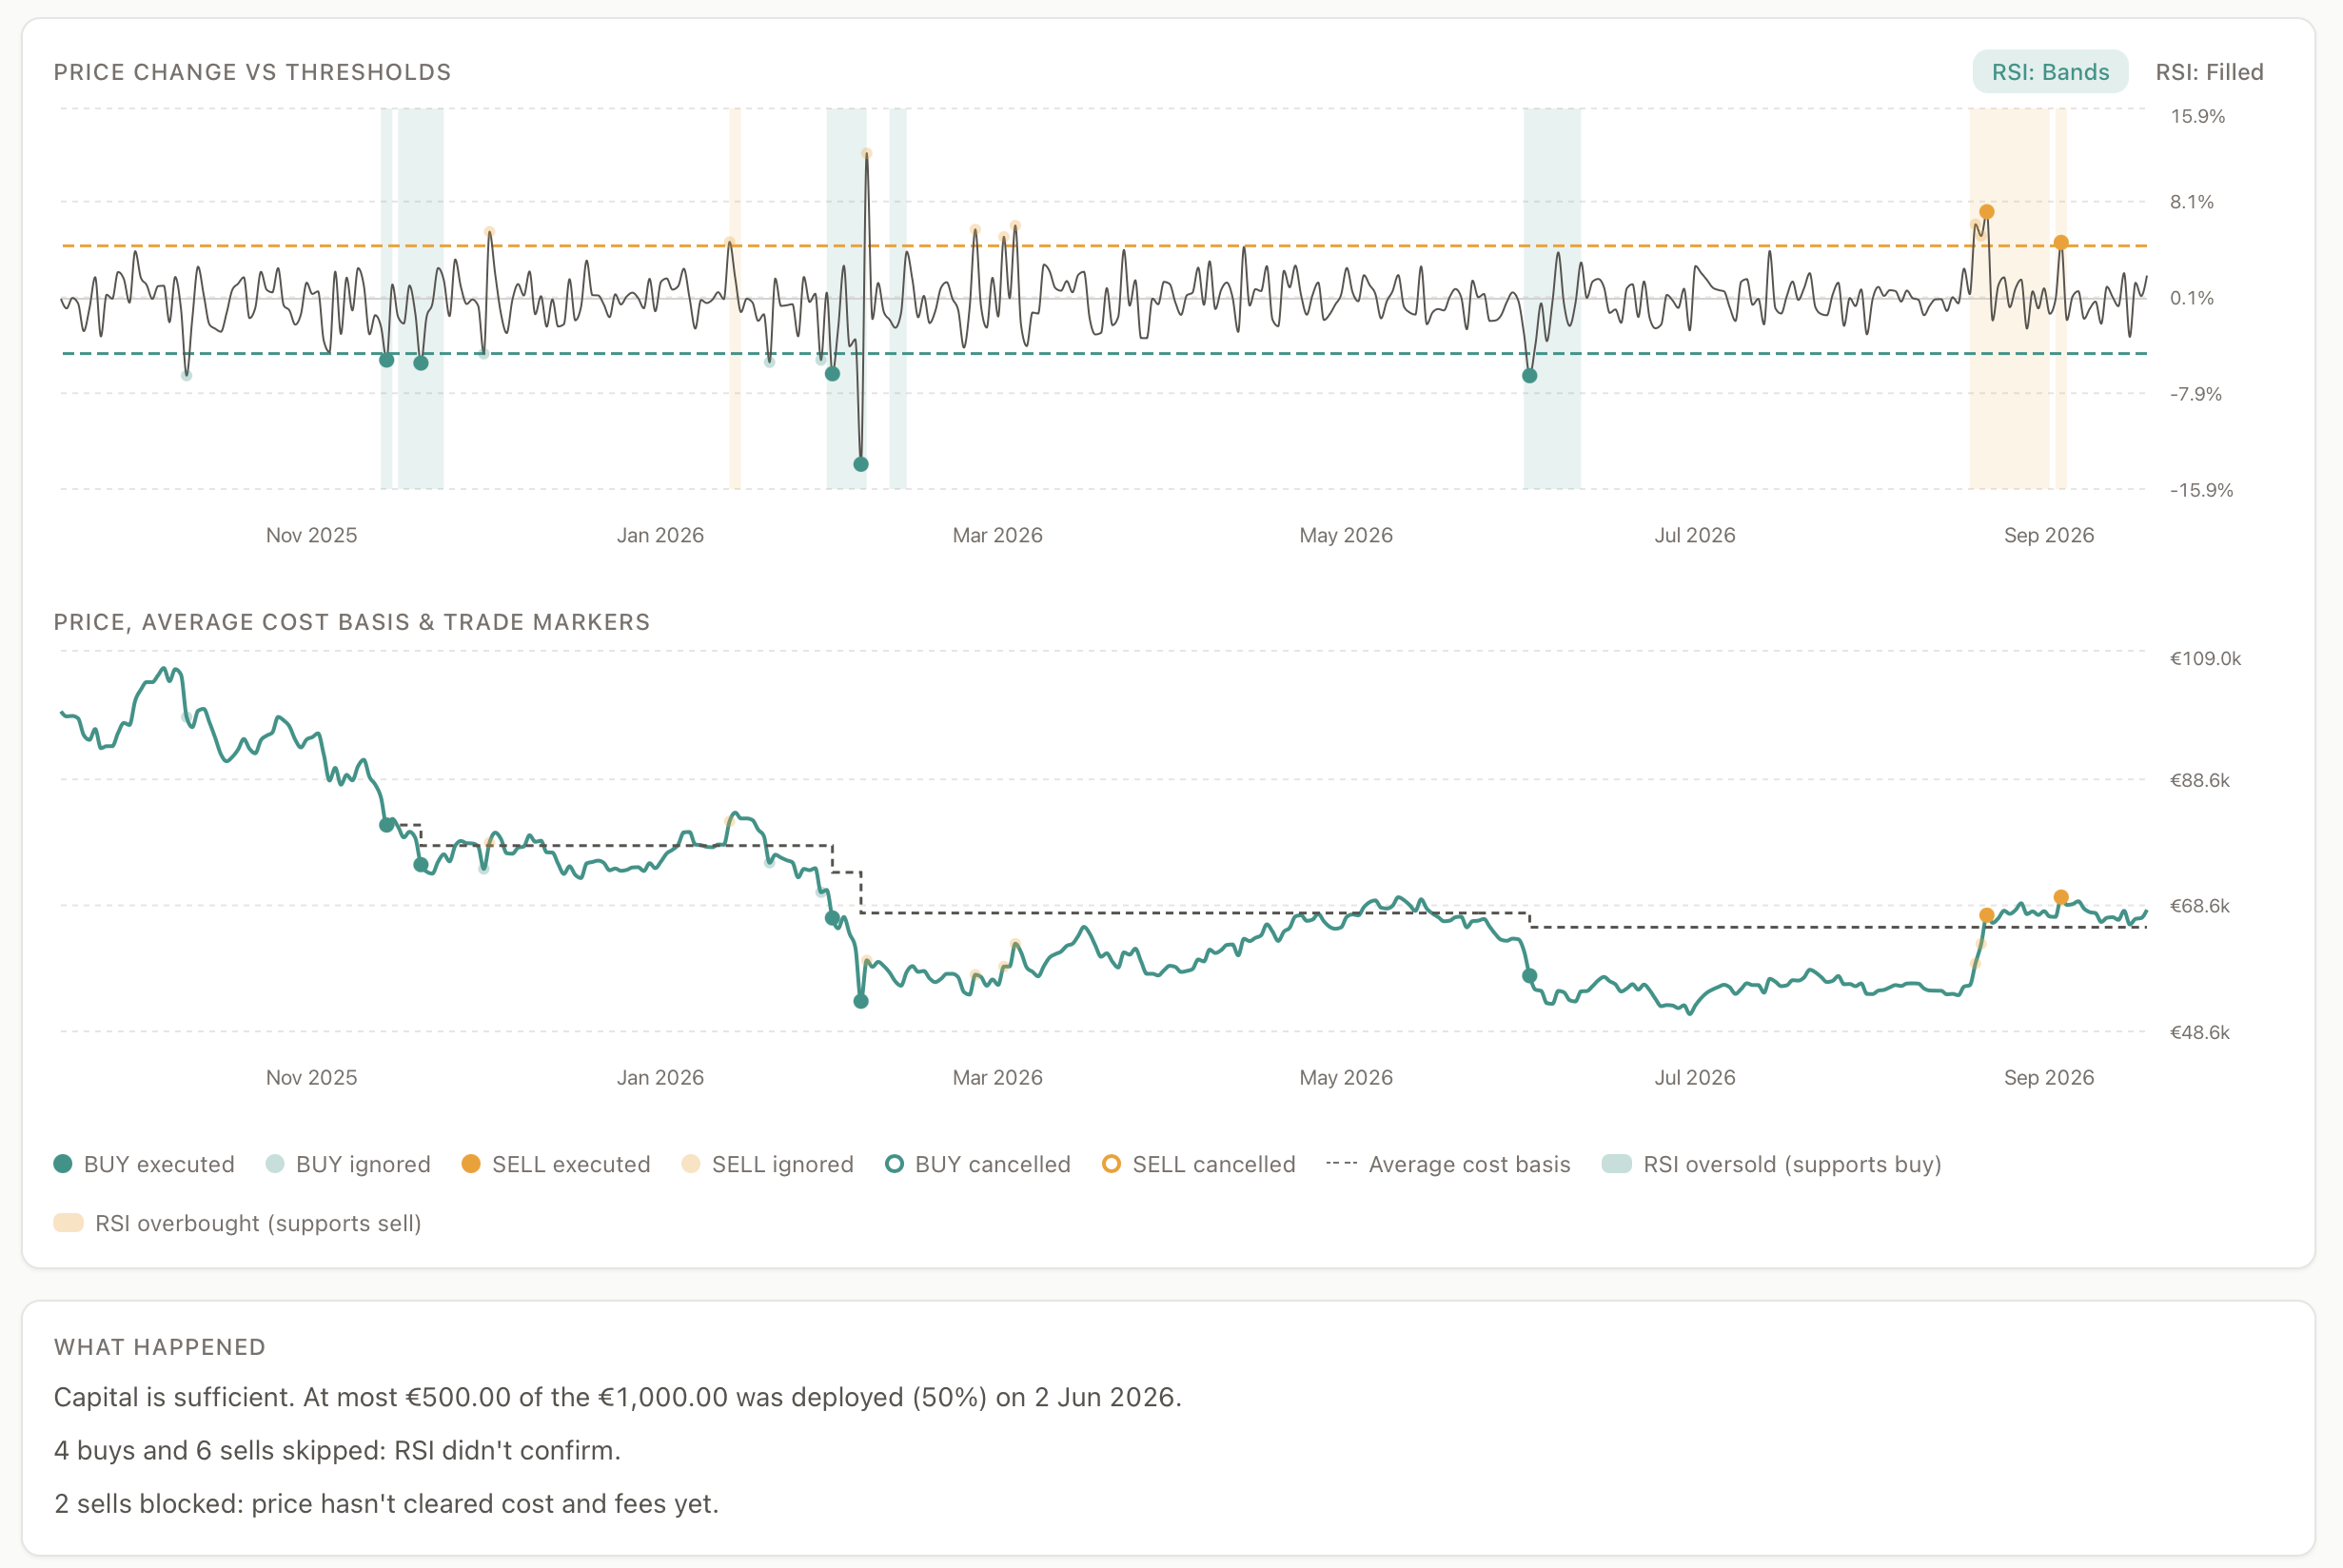
Above, the RSI: Bands style is selected (the toggle sits top right of the chart). Teal shading marks where RSI read oversold and therefore supported a buy, amber where RSI read overbought and supported a sell. The legend gains two entries that are absent without RSI, and the What happened summary counts the skipped signals separately from the ones blocked on cost and fees.
What RSI Confirmation Does Not Do
Section titled “What RSI Confirmation Does Not Do”RSI confirmation does not:
- Trigger a trade by itself. A price trigger still has to fire first
- Override the average cost base rule. A sell blocked by cost base stays blocked regardless of RSI
- Predict direction. RSI reports what momentum has already done, not what price will do next
- Adjust itself over time. The three values stay exactly as you set them until you create a new version
Key Takeaway
Section titled “Key Takeaway”RSI confirmation makes your triggers more selective, not more active.
Expect fewer trades with RSI confirmation on. That is the intended effect: every trade that does go through has cleared both a price condition and a momentum condition.
If your strategy suddenly trades far less than before, check the Calibration card on the Evaluate tab first. A large “RSI not oversold” count means your thresholds are doing their job, possibly harder than you intended.
The Same Strategy, Simulated Both Ways
Section titled “The Same Strategy, Simulated Both Ways”Without RSI confirmation:
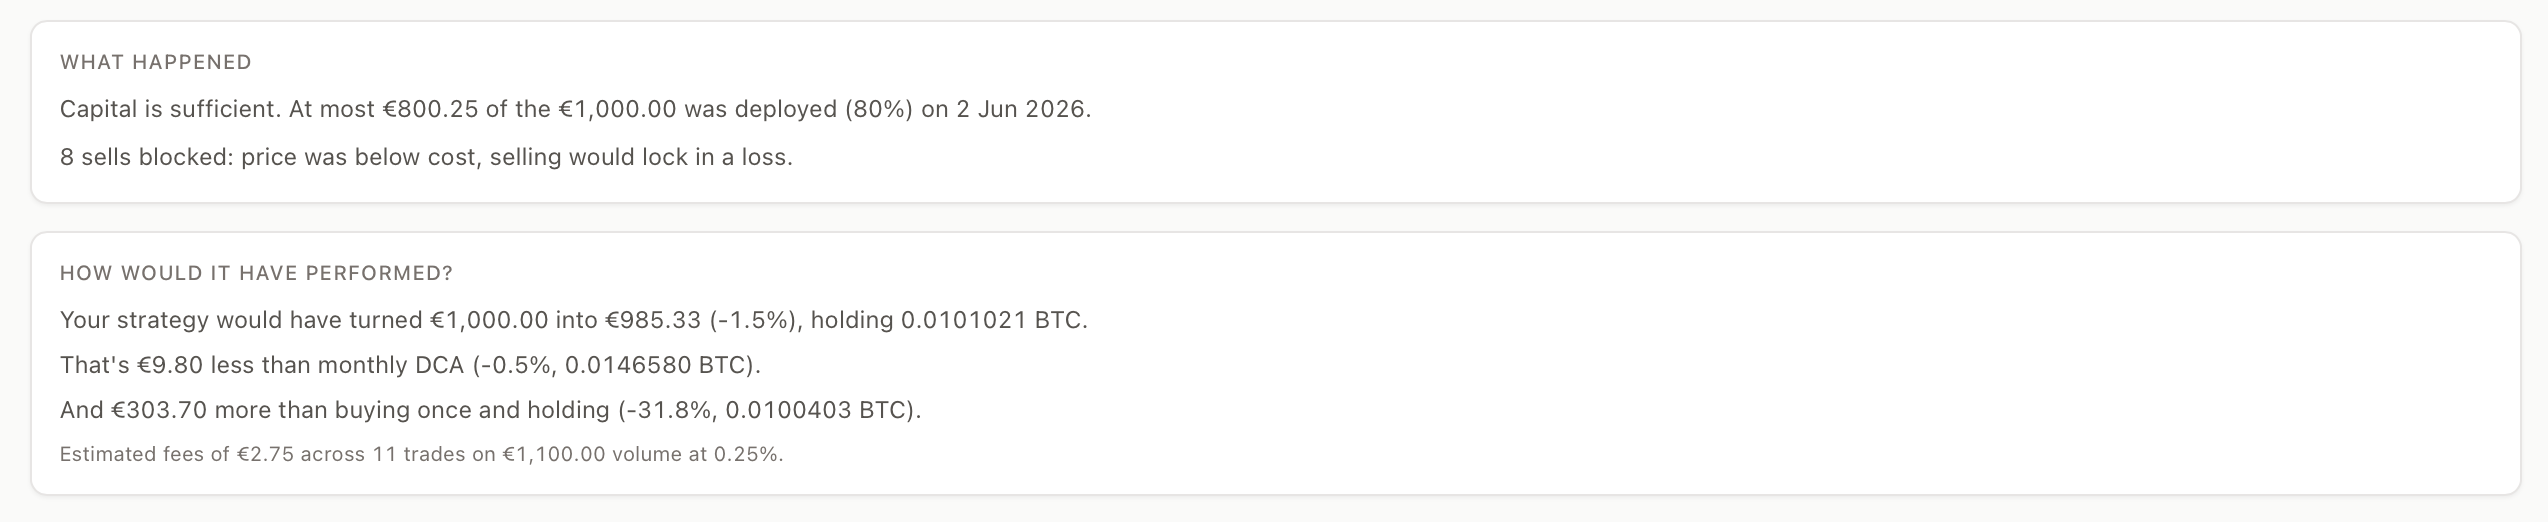
With RSI confirmation added:
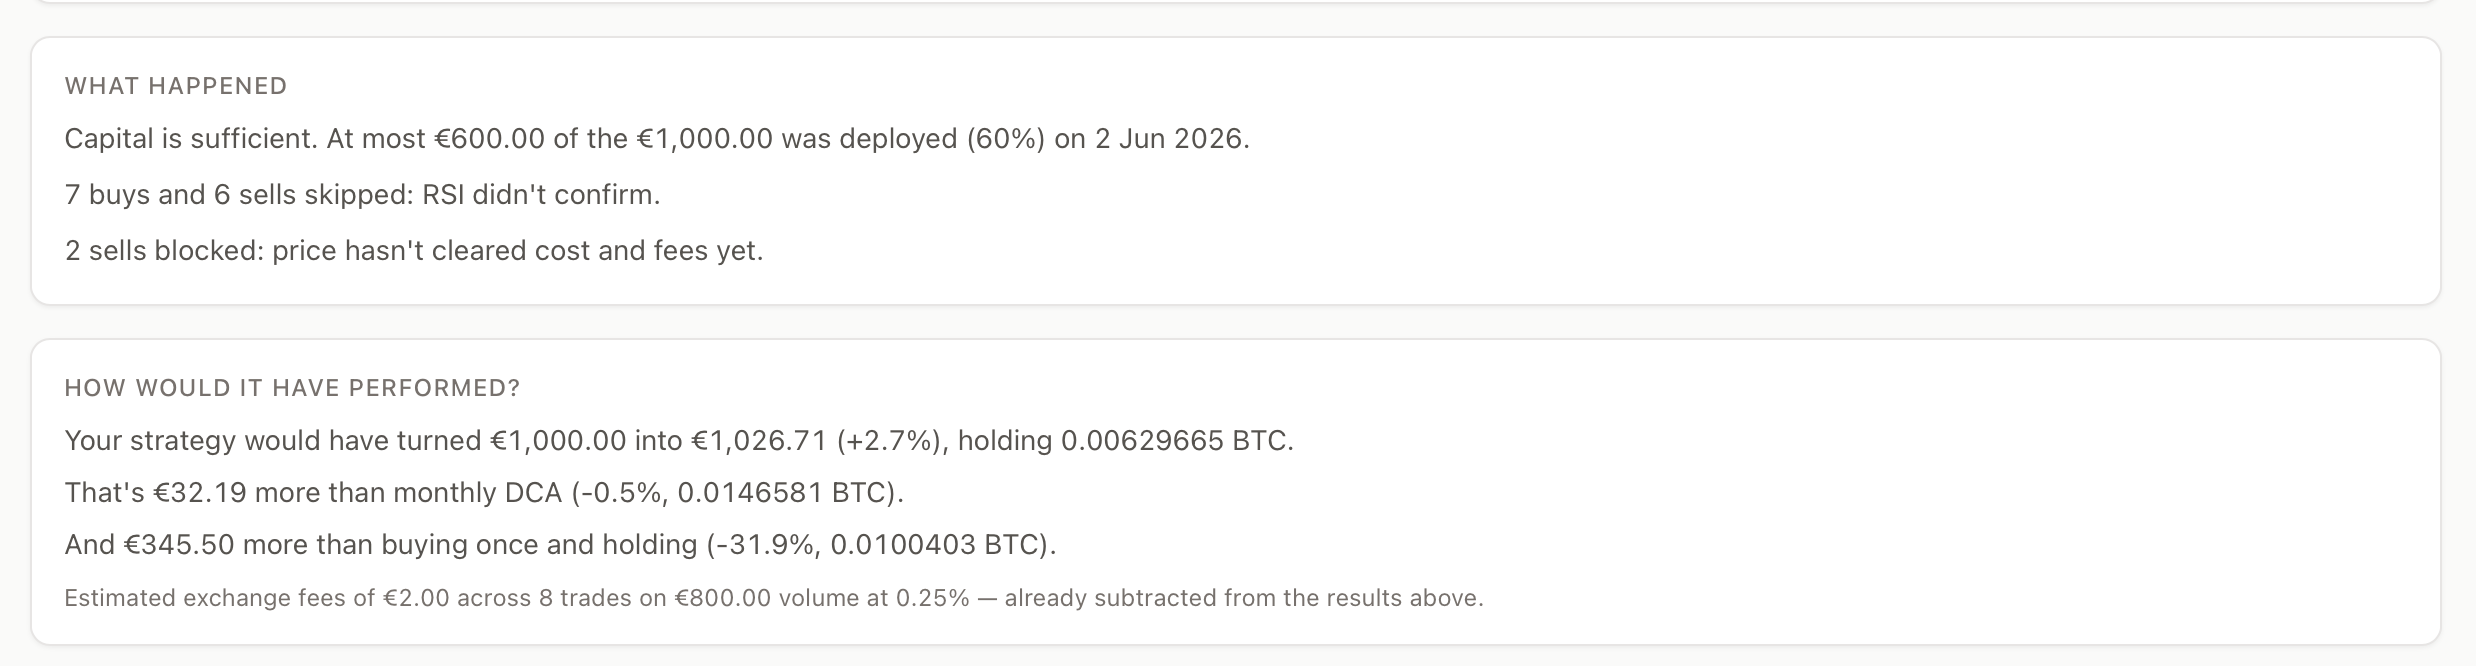
The trade count falls from 11 to 8, and the character of the summary changes: without RSI the only thing holding sells back is cost basis, while with RSI most skipped signals never reached that check.
That is the behaviour to take from this pair. It is one backtest, on one asset, over one period, and it is not evidence that RSI confirmation improves returns. A different asset or a different year can just as easily show the selective version skipping the trades that would have worked out. Run the comparison on your own asset and period before deciding.
Next Page
Section titled “Next Page”Continue with:
Average Cost Base Explained
/strategy-builder/average-cost-base